Ultra low carbon bake hardening steel for automobile (ULC-BH steel) is a high-quality automobile steel with low yield strength before stamping.
After stamping or pre stretching deformation, the yield strength can be improved to a certain extent by aging treatment at baking temperature.
For bake hardening steel, the content of solid solution elements, especially the content of solid solution carbon, is the most important factor affecting its bake hardening property (i.e. the bake hardening value BH2), so it is necessary to realize quantitative analysis of the content of solid solution carbon.
Because the relationship between the solid solution carbon content in the ultra-low carbon bake hardening steel and the hot rolling, cold rolling processes and BH2 values is complex, researchers such as Shi Xing and Ju Xinhua from the Technical Research Institute of Shougang Group Co., Ltd. hope to establish the relationship between the solid solution carbon content and the BH2 value of the final product using internal friction technology, and thus find the best process parameters that give consideration to the mechanical properties of materials and apply them to guide the actual production.
The researchers mainly simulated and investigated the influence of different hot rolling coiling temperature, annealing temperature and slow cooling temperature on the solid solution carbon content and BH2 value of the test steel for ultra-low carbon bake hardening steel, so as to provide a theoretical basis for the on-site process improvement of bake hardening steel.
1. Test materials and methods
1.1 Test materials
The test material is ULC-BH steel hot rolled slab with a thickness of 4.5mm.
In the pilot scale simulation laboratory, the process simulation was carried out according to different hot rolling coiling temperature, different annealing temperature and slow cooling temperature to investigate the change rule of the solid solution carbon content and BH2 value of the test steel under different processes.
The specific simulation process is:
① The hot rolled slabs with the same composition are hot rolled and coiled at different coiling temperatures (660, 700, 730 ℃), and then the products with different hot rolled coiling temperatures are cold rolled and then annealed at 780 ℃, with a strip speed of 200m · min-1;
② 700 ℃ hot rolled coils with the same composition are annealed at different temperatures (780, 810, 840 ℃) after cold rolling;
③ The test plates with the same composition after hot rolling and crimping at 700 ℃ and annealing at 780 ℃ were slowly cooled at different slow cooling temperatures (650, 680, 710 ℃).
1.2 Test method
The 55mm×4mm×1mm rectangular sample to be tested shall be processed with a carbon analyzer in steel according to the method specified in GB/T 13665-2007 Test Methods for Damping Power of Metal Damping Materials – Torsion Pendulum Method and Bending Vibration Method for internal friction test.
The universal tensile testing machine is used to measure the increase value of the lower yield strength of the pre tensioned specimen with 2.0% total strain after baking at 170 ℃ for 20min, which is BH2 value, relative to the strength corresponding to 2.0% total strain of the specimen, according to the national standard GB/T 24174-2009 Determination of Bake Hardening Value (BH2) of Steel.
2. Test results and analysis
2.1 Effect of different crimping temperatures
The change curves of internal friction, solid solution carbon content and BH2 value of test steel at different crimping temperatures are shown in Fig. 1.
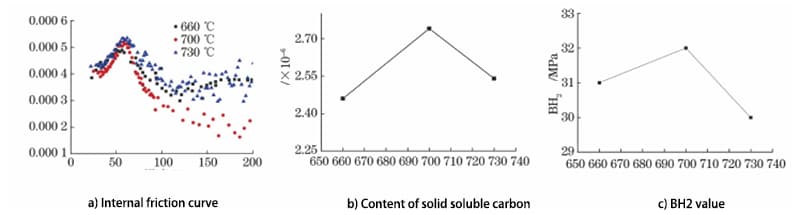
Fig. 1 Internal friction curve, solid solution carbon content and BH2 value of ULC-BH steel at different crimping temperatures
It can be seen from Fig. 1a) that under the crimping temperature of 660, 700, 730 ℃, the internal friction test of ULC-BH test steel shows obvious C-Snoek peak near 50 ℃, but with the increase of crimping temperature, the C-Snoek peak height has little difference, about 0.00055.
Using the linear relationship between the internal friction peak caused by the solid solution carbon and the solid solution carbon, it can be quantitatively calculated that the corresponding solid solution carbon content (mass fraction, the same below) at 660, 700, 730 ℃ is 2.46 × 10-6,2.74 × 10-6,2.54 × 10-6.
From the calculation results, it can be seen that the crimping temperature has little effect on the solid solution carbon content of the test steel, and the difference is 0.3 × 10⁻⁶, as shown in Fig. 1b).
It can also be seen from Fig. 1c) that the coiling temperature has no significant effect on the BH2 value of the final product.
2.2 Effect of annealing temperature
The change curves of internal friction, solid solution carbon content and BH2 value of test steel at different annealing temperatures are shown in Fig. 2.

Fig. 2 Internal friction curve, solid solution carbon content and BH2 value of ULC-BH steel at different annealing temperatures
It can be seen from Fig. 2 that the annealing temperature is very sensitive to the influence of the solid solution carbon content and BH2 value in ULC-BH test steel.
Under the annealing temperature of 780810840 ℃, the internal friction test of ULC-BH test steel also shows obvious C-Snoek peak near 50 ℃;
The annealing temperature increased from 780 ℃ to 840 ℃, and the peak value of C-Snoek internal friction increased from 0.00050 to 0.00065.
Fitting calculation of C-Snoek internal friction peak at different annealing temperatures in Fig. 2a) shows that the corresponding solid solution carbon content at 780, 810, 840 ℃ is 2.22 × 10-6,4.11 × 10-6,7.15 × 10-6, that is, the content of solid solution carbon increases with the increase of annealing temperature, with a range of 2 × 10⁻⁶~3 × 10⁻⁶, as shown in Fig. 2b).
It can be seen from Fig. 2c) that the BH2 value of the test steel also increases with the increase of annealing temperature.
2.3 Effect of slow cooling temperature
The change curves of internal friction, solid solution carbon content and BH2 value of test steel under different slow cooling temperatures are shown in Fig. 3.

Fig. 3 Internal friction curve, solid solution carbon content and BH2 value of ULC-BH steel at different slow cooling temperatures
It can be seen from Fig. 3 that the slow cooling temperature is also very sensitive to the influence of the solid solution carbon content and BH2 value in ULC-BH test steel.
Under different slow cooling temperatures of 650680710 ℃, the internal friction test of ULC-BH test steel shows obvious C-Snoek peak near 50 ℃, but when the slow cooling temperature increases from 650 ℃ to 710 ℃, the peak value of C-Snoek internal friction decreases from 0.00072 to 0.00055.
The fitting calculation of C-Snoek internal friction peak at different slow cooling temperatures in Fig. 3a) shows that the corresponding solid solution carbon content at 650, 680, 710 ℃ is 4.58 × 10-6,3.99 × 10-6,2.57 × 10-6.
That is, when the slow cooling temperature is 650 ℃ and 680 ℃, there is little difference in the content of solid solution carbon in the sample steel, but the slow cooling temperature increases from 680 ℃ to 710 ℃, and the content of solid solution carbon decreases with the increase of the slow cooling temperature, with a range of about 1.5 × 10⁻⁶, as shown in Fig. 3b).
It can be seen from Fig. 3c) that the BH2 value of test steel also decreases with the increase of slow cooling temperature.
3. Conclusion
(1) Different process parameters have great influence on the content of solid solution carbon and BH2 value of ultra-low carbon bake hardening steel, while crimping temperature has little influence on the content of solid solution carbon and BH2 value of test steel.
(2) With the increase of annealing temperature, the solid solution carbon content and BH2 value of the test steel increase gradually, and the annealing temperature rises from 780 ℃ to 840 ℃, the solid solution carbon content increases by 2 × 10⁻⁶~3 × 10⁻⁶.
(3) With the increase of slow cooling temperature, the solid solution carbon content and BH2 value of the test steel decrease gradually, and the slow cooling temperature increases from 650 ℃ to 710 ℃, and the solid solution carbon content decreases by about 1.5 × 10⁻⁶.