Austenitic stainless steel is one of the main materials used in nuclear reactor structures, which contain a large number of welded parts.
A small amount of δ-ferrite in stainless steel welds can improve the strength and intergranular corrosion resistance of the weld, and prevent welding hot cracks. However, too much δ-ferrite will cause σ-phase embrittlement and δ-phase selective corrosion.
The δ-ferrite content is one of the important technical indexes for the development and application performance evaluation of austenitic stainless steel welding materials.
At present, the commonly used methods for determining δ-ferrite content in austenitic stainless steel welds are the metallographic method, chemical method, and magnetic method.
The metallographic method calculates the area ratio by directly observing the δ-ferrite in the metallographic sample, and then calculates the volume fraction. This method is destructive and requires a sufficient number of measuring points to obtain data with high reliability, which increases detection cost.
The chemical method can indirectly obtain δ-ferrite content (mass fraction) by calculating the nickel equivalent and chromium equivalent in the material and comparing the empirical diagram. The Schaeffer diagram, Delong diagram, and WRC-92 diagram are three diagrams commonly used in chemical methods at present. The Schaeffer diagram was the first applied, but it did not consider the influence of nitrogen and copper. The Delong diagram includes nitrogen as the forming element of austenite and improves curve accuracy. The WRC-92 diagram also considers nitrogen and copper.
The chemical method also has some problems, such as the accuracy of alloy element content directly affecting the accuracy of δ-ferrite content calculation and the non-linearity of the effect of alloying elements on δ-ferrite content, which leads to a certain deviation between the measured value and the actual value.
The magnetic method determines the content of δ-ferrite by measuring a certain magnetic physical quantity related to the content of δ-ferrite. However, this method is greatly affected by the principle of the measuring instrument, and if the content or morphology of δ-ferrite in the material is uneven, the reproducibility and accuracy of the results are poor.
The magnetic method is easy to operate and can realize on-site nondestructive testing, which is commonly used. In actual detection, one or two methods are usually selected for measurement.
Researchers from the Key Laboratory of Reactor Fuel and Materials of China Nuclear Power Research and Design Institute simultaneously used the above three methods to measure the δ-ferrite content of austenitic stainless steel surfacing layer for nuclear power and compared and analyzed the differences in measurement results obtained by the different detection methods.
1. Test contents
1.1 Test materials
The research object is a 308 stainless steel overlay with a sample size of 50mm × 25mm × 10mm. Its chemical composition satisfies the specifications outlined in ASTM A276-2006 for Stainless Steel Bars and Shapes.
1.2 Test standards
Metallographic testing was performed in accordance with the standards of GB/T 1954-2008 for measuring the ferrite content of chromium-nickel austenitic stainless steel welds and GB/T 15749-2008 for quantitative metallography.
In addition to the existing detection methods, a chemical composition analysis was conducted using the Schaeffler and WRC-1992 diagrams to calculate the δ-ferrite content.
To measure the ferrite number in the chromium-nickel austenitic stainless steel weld metal, the magnetic method was used following the guidelines of GB/T 1954-2008 and JB/T 7853-1995.
1.3 Test equipment
The metallographic method employed for detection and analysis utilized the Olympus GX71 metallographic microscope and its supporting TIGER3000 metallographic image analysis system.
In terms of chemical analysis, a carbon/sulfur analyzer was used for detecting carbon and sulfur, a spectrophotometer was employed to detect silicon, phosphorus, and boron, and an inductively coupled atomic emission spectrometer was utilized for detecting other metal elements.
Regarding the measurement of δ-ferrite content, it was directly read by the ferrite measuring instrument during the magnetic method.
2. Test process and results
2.1 Metallographic method
There are two main metallographic methods used to measure the content of δ-ferrite: the standard sample atlas contrast method and the measurement method. Both of these methods can be used to measure the δ-ferrite content in the surfacing layer of 308 stainless steel.
2.1.1 Map comparison method
According to the GB/T 1954-2008 standard, the metallographic sample is prepared and observed under a microscope. A relatively uniform area of δ-ferrite distribution is then selected for photography, as shown in Figure 1.
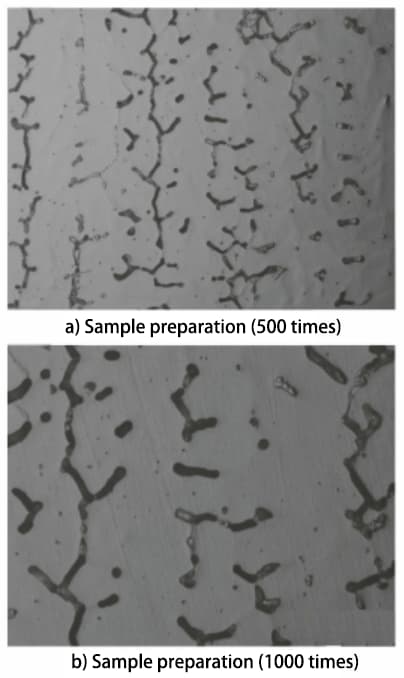
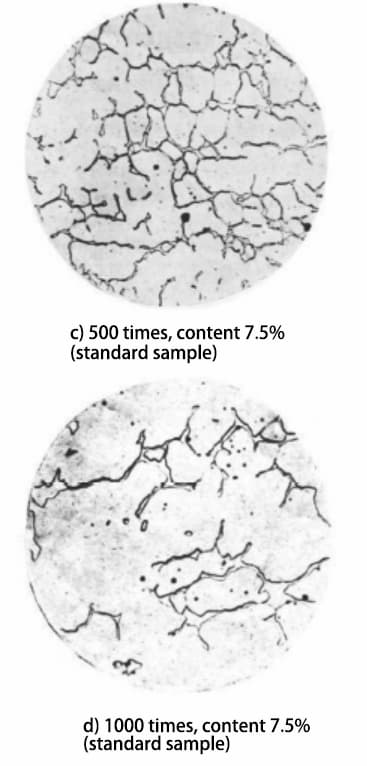
Fig. 1 Microstructure morphology of prepared and standard samples
In accordance with the specifications outlined in the GB/T 1954-2008 standard, the microstructure of the prepared metallographic sample should be observed at a magnification of no less than 500 times. Microstructures of the sample prepared at both 500 and 1000 times magnification were obtained and compared to the microstructures of standard samples at the same magnifications. Based on this comparison, it was determined that the content of δ-ferrite in the sample falls between 7.5% and 10%.
2.1.2 Measurement method
The GB/T 15749-2008 standard is a national standard that applies to the determination of phase volume fraction in various alloy microstructures. It includes a variety of phase content calculation methods such as the grid number point method, grid section method, and line segment calibration method (including four line method, eight line method, etc.).
Compared to the metallographic secant method in GB/T 1954-2008, the methods outlined in GB/T 15749-2008 have more dividing lines, a larger coverage area, and higher accuracy.
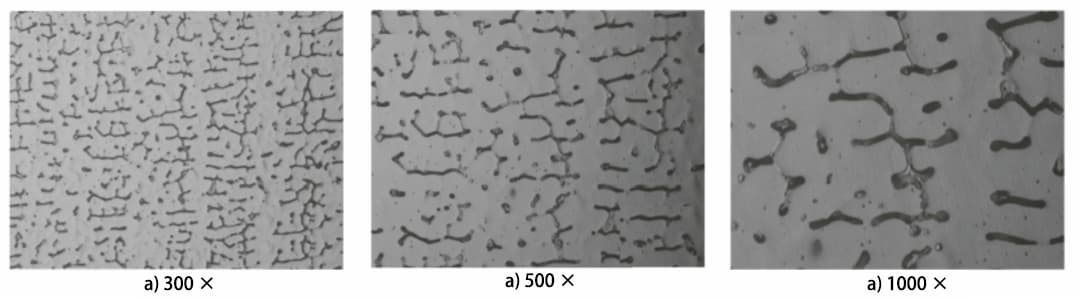
Fig. 2 Microstructure of δFerrite in Weld at the Same Position
According to the GB/T 15749-2008 standard, the grid section method measures the sample 300 times, 500 times, and 1000 times.
Figure 2 displays the microstructure at the same position. The average δ ferrite content measured at different multiples is 11.0%, 7.6%, and 9.5%, respectively (refer to Table 1).
Table 1 δ Ferrite Content at the Same Location under Different Magnification Times
| Amplified | Mass fraction | |||||||||
| 1 | 2 | 3 | 4 | 5 | 6 | 7 | 8 | 9 | Mean value | |
| 300 times | 10 | 9.7 | 11.6 | 11.7 | 12.7 | 10.8 | 11.5 | 10.6 | 10.8 | 11 |
| 500 times | 8.2 | 10 | 8.8 | 6.1 | 10.1 | 6.4 | 9.3 | 9.8 | 9.3 | 7.6 |
| 1000 times | 10.6 | 11 | 8.2 | 7.7 | 10 | 7.8 | 10.5 | 10.8 | 9.6 | 9.6 |
Table 1 shows that the δ ferrite content varies greatly at different magnifications.
The lowest δ ferrite content is measured at 500 times magnification, while the content measured at 300 and 1000 times is higher.
The test results indicate that magnification has a significant impact on the metallographic analysis results:
In welds, δ ferrite grains are usually very small. At low magnification (300 times), the microstructure within the field of view appears too dense, making it difficult to discern the edge of the image segmentation calculation, resulting in generally larger results.
Conversely, at too high a magnification (1000 times), the selected field of view area is too small. As the tissue itself is uneven, more points may need to be measured to obtain accurate results.
GB/T 1954-2008 specifies a minimum magnification of 500 times. Therefore, selecting a magnification of 500 times for actual measurements is appropriate.
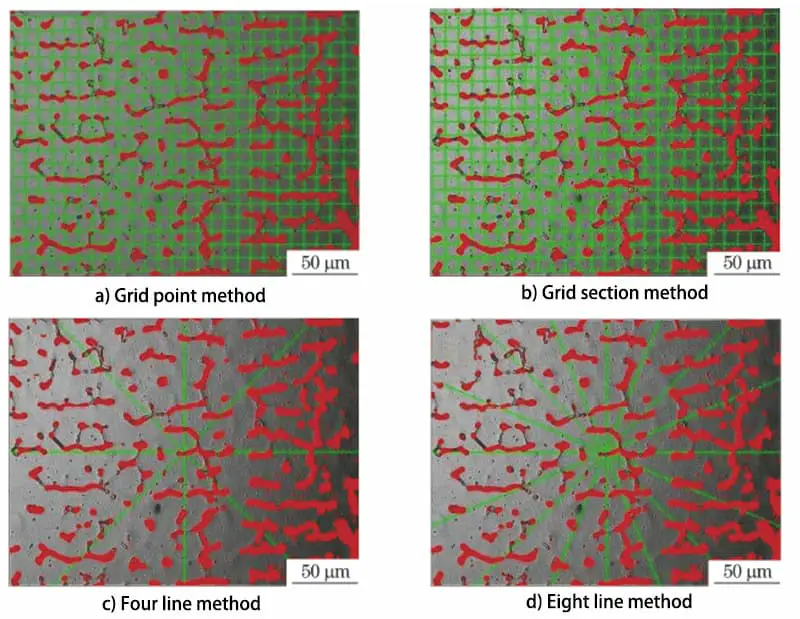
Fig. 3 Schematic Diagram of δFerrite Content Measurement Method
In the test, we used the grid number point method, grid section method, four line method, and eight line method, respectively. We randomly selected 9 locations under 500 different conditions to measure the δ-ferrite content, and the measurement method is shown in Fig. 3.
The results of these measurements were 7.6%, 7.6%, 6.7%, and 7.6%, respectively, as shown in Table 2.
Table 2: δ-Ferrite content measured at random locations under 500 ×
| Position and mean | Grid number point | Grid section | Four line | Eight line |
| 1 | 6.9 | 8.2 | 4.1 | 6.9 |
| 2 | 8.2 | 10 | 6.6 | 8.8 |
| 3 | 9.2 | 8.8 | 5.1 | 5.8 |
| 4 | 5.6 | 6.1 | 6.5 | 5.9 |
| 5 | 10.2 | 10.1 | 7.7 | 7.9 |
| 6 | 4.2 | 6.4 | 5.5 | 6.3 |
| 7 | 7.9 | 9.3 | 9 | 9.3 |
| 8 | 8.3 | 9.8 | 5.9 | 8.5 |
| 9 | 7.5 | 9.3 | 9.6 | 9.2 |
| mean | 7.6 | 7.6 | 6.7 | 7.6 |
According to Table 2, it can be observed that, with the exception of the four line method, the measurement results of the other three methods are the same.
2.2 Chemical method
The chemical composition of the surfacing layer of 308 stainless steel is presented in Table 3, and it meets the specified technical indicator requirements.
Table 3 Chemical Composition of 308 Stainless Steel Overlay
| C | Cr | Ni | Mo | Mn | Co | Cu | V | S | B | P | Si |
| 0.028 | 19.25 | 10.4 | 0.065 | 1.38 | 0.02 | 0.03 | 0.04 | 0.0078 | 0.0006 | 0.013 | 0.73 |
Based on the Schaeffler diagram and its calculation formula, the mass fractions of chromium and nickel in the test material are 20.41% and 10.93%, respectively, indicating a δ-ferrite content of about 8.5%.
On the other hand, referring to the WRC-1992 figure, the mass fractions of chromium and nickel in the test material are 19.315% and 10.24%, respectively, resulting in a δ-ferrite content of approximately 13%.
It is evident that the chemical method’s calculation results vary when different experience charts are used due to the influence of various factors.
Further analysis reveals that the inclusion of copper as a nickel equivalent in the WRC-1992 diagram, along with 308 stainless steel’s 0.03% copper content, leads to a considerably higher calculated δ-ferrite content than that obtained using the Schaeffler diagram.
2.3 Magnetic method
As per the specifications stated in the GB/T 1954-2008 standard for magnetic method measurement, six points should be randomly selected along the direction of the weld bead of the 308 stainless steel surfacing layer. The measurement results should be obtained by averaging five readings at each point, and the average δ-ferrite content is calculated to be 3.4%.
3. Analysis and discussion
The content of a-ferrite in the surfacing layer of 308 stainless steel was measured using metallographic, chemical, and magnetic methods, as shown in Table 4.
The δ-ferrite content in the weld structure of austenitic stainless steel is typically between 4% and 12%.
It is apparent that the magnetic method produced lower measurements, whereas the WRC-1992 diagram measurement results from the chemical method were higher.
Table 4 308 Stainless Steel Overlay Measured by Different Methods δ Ferrite content
| Measuring method | δ -Ferrite mass fraction | |
| Metallography (500 times) | Atlas contrast method | 10.0 |
| Measurement method | 7.6 | |
| Chemical method | Schaeffler chart | 8.5 |
| WRC-1992 chart | 13.0 | |
| Magnetic method | 3.4 | |
When measuring δ-ferrite content using different methods such as grid number point method, grid section method, four line method and eight line method, the four line method tends to have the least measurement data due to the uneven distribution and shape of δ-ferrite in each field of view, leading to larger deviations.
Although the metallographic method offers a large and random field of view, the reliability of its results is generally high.
To reduce the adverse effects of measurement methods and improve the reliability of results, the appropriate measurement method should be selected by comprehensively considering factors such as magnification, field of view position, and differences between the principles of different methods.
At 500x magnification, the average values of δ-ferrite content obtained from the grid number method, grid section method, and eight line method are the same, indicating a more reliable result of 7.6% δ-ferrite content.
The chemical method uses element content detection results to calculate and compare an experience chart to obtain δ-ferrite content. The accuracy of the chemical element measurement directly affects the accuracy of the results.
The chemical method is directly affected by factors such as the accuracy of element measuring instruments and the selection of experience charts.
The magnetic method tends to produce relatively small measurement results due to differences in physical quantities measured by different instruments and measurement errors of the instruments themselves. Additionally, the morphology and distribution of δ-ferrite may be uneven in materials with low δ-ferrite content.
Poor sampling locations can lead to poor reproducibility and accuracy of determination results.
During testing and production, it is recommended to avoid relying on a single method to measure the δ-ferrite content of welds, and to use multiple methods for mutual verification.
4. Conclusion
(1) Each of the three methods has advantages and disadvantages, and they should be selected according to the specific situation.
The metallographic method is a destructive testing method, but it provides highly reliable measurement results. During testing, it is necessary to consider magnification, field of view position, and the differences between various methods and principles, in order to select the appropriate measurement method.
The chemical method can easily and quickly obtain detection values based on the known chemical composition of the material. However, it is important to select an appropriate experience chart and calculation formula.
The magnetic method is a non-destructive inspection method that is suitable for rapid inspection of large material components on site, but its measured value is low.
(2) The measurement results obtained using the metallographic atlas comparison method and the chemical Schaeffler diagram method are similar. Similarly, the measurement results obtained using the grid number method, grid section method, and eight line method in the metallographic measurement method are also the same. Therefore, these methods can be used as alternative methods in actual detection.