Explore Electrical Conductivity of Common Copper, Aluminum Alloys
What if the key to enhancing the performance of high-voltage switchgear lies in understanding the electrical conductivity of copper and aluminum alloys? This article dives into the specifics of conductivity in these materials, offering essential reference values for design, quality inspection, and procurement. By exploring this guide, you’ll gain a solid grasp of how different alloys compare and how to leverage this knowledge in practical applications.
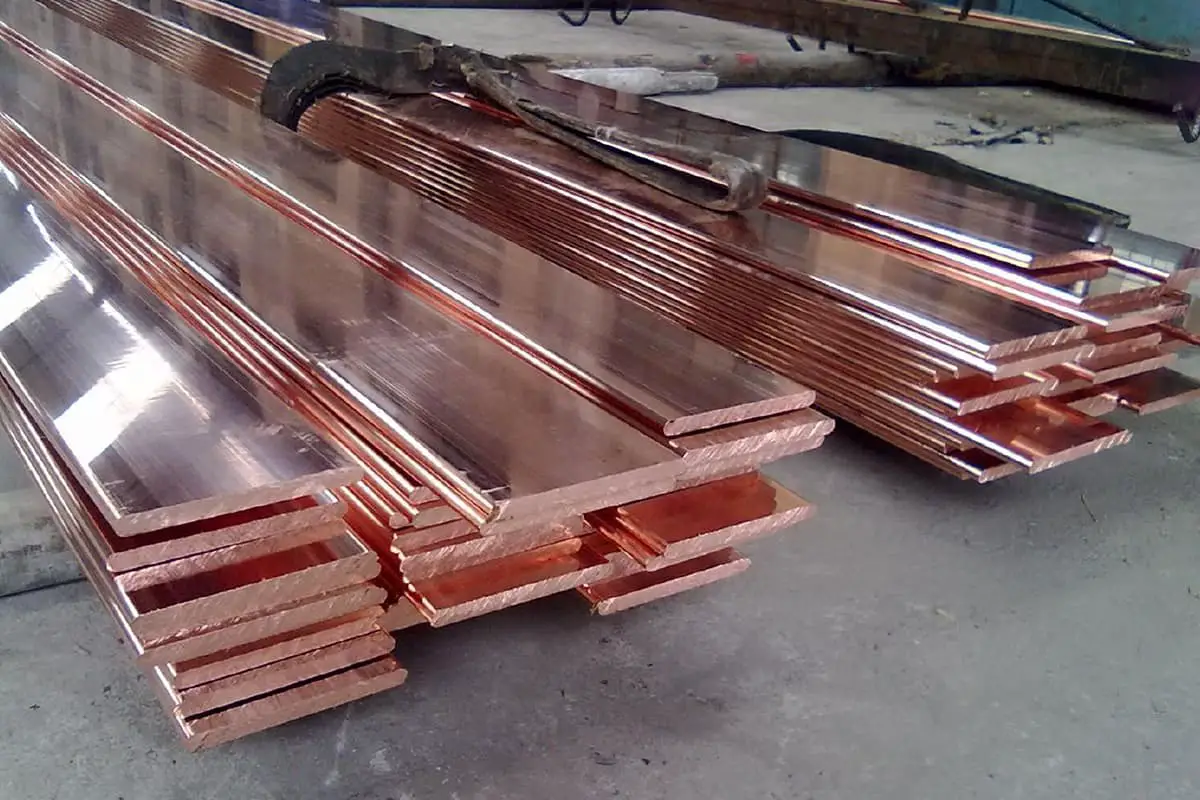
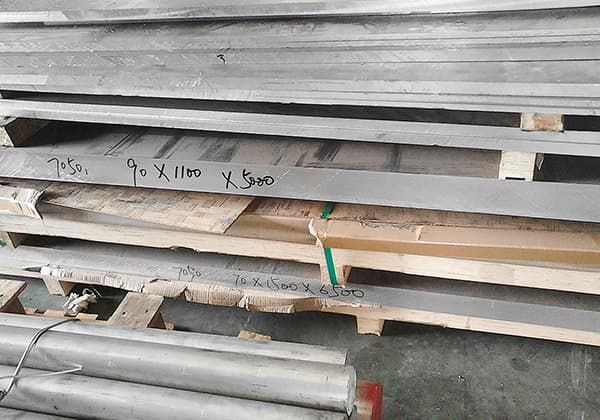
Copper, aluminum, and their alloys are frequently used materials in high-voltage switchgear products.
This standard lists the electrical conductivity of commonly used copper, aluminum, and their alloys, serving as a reference for design, process, quality inspection, and procurement personnel in their work.
1. Scope
This standard provides reference values for the electrical conductivity of copper, aluminum, and their alloys. It is intended for reference in the design, process, quality inspection, and procurement of high-voltage switch products and components.
2. Terminology
Electrical Conductivity
The reciprocal of resistivity is referred to as electrical conductivity. It corresponds to the current passing through a unit area when the conductor maintains a unit potential gradient (i.e., voltage difference).
According to the IEC standard, the electrical conductivity of standard soft copper with a resistivity of 1.7241μΩ·cm is taken as 100%, and the electrical conductivity of other materials is compared with it, expressed in %IACS.
Based on the above definition, this standard provides reference values for the electrical conductivity of materials with only resistivity found (highlighted in bold italics in the table). The calculation method is as follows:
Material’s conductivity ÷ Standard soft copper’s conductivity × 100% = IACS unit conductivity
For example; the resistivity of ZL101A is known to be 0.0442 x 16-6Ω.m, the conductivity is:
As the founder of MachineMFG, I have dedicated over a decade of my career to the metalworking industry. My extensive experience has allowed me to become an expert in the fields of sheet metal fabrication, machining, mechanical engineering, and machine tools for metals. I am constantly thinking, reading, and writing about these subjects, constantly striving to stay at the forefront of my field. Let my knowledge and expertise be an asset to your business.
Have you ever wondered how power is transmitted in various machines and devices? From the engines that propel our vehicles to the motors that drive our industries, power transmission is…
What makes busbars crucial in electrical systems? Busbars, key components in substations and distribution systems, efficiently transmit electrical energy. This article explores their function, various types like rectangular and tubular,…
What makes 7050 aluminum alloy a standout material in high-strength applications? This blog post explores its unique composition, including zinc, magnesium, copper, and zirconium, which enhance its strength and resistance…
Imagine a world where nearly anything can be created layer by layer, from intricate medical implants to entire houses. This is the power of 3D printing. Our article explores the…
Imagine unlocking the precision of machine tools with a simple glass surface. Linear grating scales do just that, transforming fine lines into highly accurate measurements. This article explores how these…
Have you ever wondered who powers the world behind the scenes? In this blog post, we'll take a deep dive into the top generator manufacturers that keep the lights on…
Are you an aspiring mechanical engineer looking to excel in your field? In this blog post, we'll explore the top 10 must-know mechanical engineering design software that can elevate your…
Have you ever wondered how the gears in your car or airplane work so smoothly? This article unveils the top gear manufacturers shaping the future of mechanical engineering. You'll learn…
Have you ever wondered about the fascinating world of lithography machines? These marvels of engineering play a crucial role in the production of semiconductors, enabling the creation of intricate patterns…