In this article, we explore innovative non-destructive testing methods that reveal the true grade and strength of steel structures. Learn how scientists use hardness tests and empirical formulas to ensure safety and reliability in engineering projects. Dive in to uncover the fascinating science behind these techniques!
Accurate evaluation of the quality of steel structures in service requires determining the grade and strength of steel. This is the foundation for reliable testing and assessment.
The conventional method of determining steel strength is to extract samples from the structure for tensile testing, but this approach can cause harm to the original structure and may not be feasible for certain structures.
Thus, it is crucial to use non-destructive testing methods to calculate the grade and strength of steel.
Researchers both domestically and internationally have investigated non-destructive testing methods for determining steel strength in engineering sites. They have mainly focused on chemical composition and hardness, and have developed some empirical formulas.
These empirical formulas can be categorized into two types:
The first type involves calculating the tensile strength based on the chemical composition, as specified in the formula in GB/T 50621-2010 Technical Standard for On-site Testing of Steel Structures. However, the strength of steel materials is affected by the chemical composition and manufacturing process (such as casting, forging, rolling, and heat treatment), so relying solely on chemical composition for calculating steel strength can result in a significant deviation.
The second type involves calculating the tensile strength based on hardness. Research has shown that there is a positive correlation between hardness and tensile strength of steel. The tensile strength of materials can be estimated from hardness test results, which is a widely used method in engineering practice.
At present, the main domestic standards that can be used for this purpose are GB/T 33362-2016 Conversion of Hardness Values of Metallic Materials and GB/T 1172-1999 Conversion of Hardness and Strength of Ferrous Metals. GB/T 33362-2016 is equivalent to ISO 18265:2013 Conversion of Hardness Values of Metallic Materials. The hardness conversion table for unalloyed steel, low alloy steel, and cast steel in Table A.1 of this standard was obtained through comparison tests with verified and calibrated hardness meters in different laboratories by the German Association of Metallurgical Engineers. GB/T 1172-1999 was obtained through extensive tests and research by institutions such as the China Academy of Metrology. Table 2 in the standard mainly provides the conversion relationship applicable to low carbon steel.
However, neither of these standards provide reliable data with statistical significance for the uncertainty of conversion values, and the deviation range of conversion results is unknown. Researchers have studied the correlation between hardness and strength of steel used in building steel structures through regression analysis and compared it with national standards, which serves as a verification and supplement to GB/T 33362-2016 and GB/T 1172-1999 standards. They have also discussed the detection method suitable for steel structure project sites, incorporating the existing portable detection instruments.
1. Test sample
The research objects for this study are the commonly used Q235 and Q345 steel plates in steel structure engineering.
In order to ensure representative samples, 162 steel plates were collected from 86 steel structure manufacturers in Jiangsu Province, comprising 82 pieces of Q235 steel plates and 80 pieces of Q345 steel plates. The thickness specifications of the steel plates were 6, 8, 10, 12, 14, 18, 20, and 30 mm.
The steel plates were processed into 20mm x 400mm strip samples and tensile tests were conducted using a microcomputer-controlled electro-hydraulic servo tensile testing machine, in accordance with the requirements of GB/T 228.1-2010.
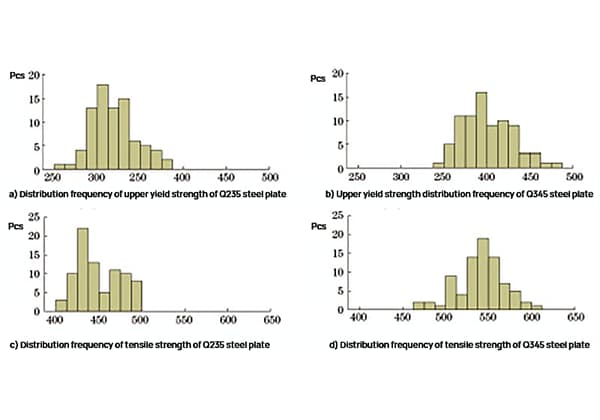
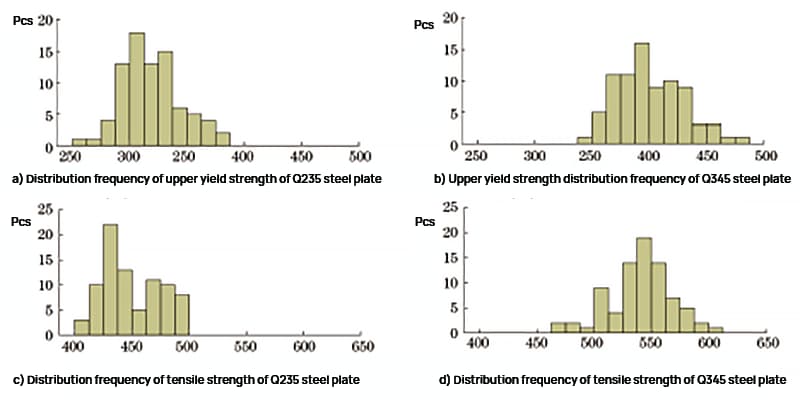
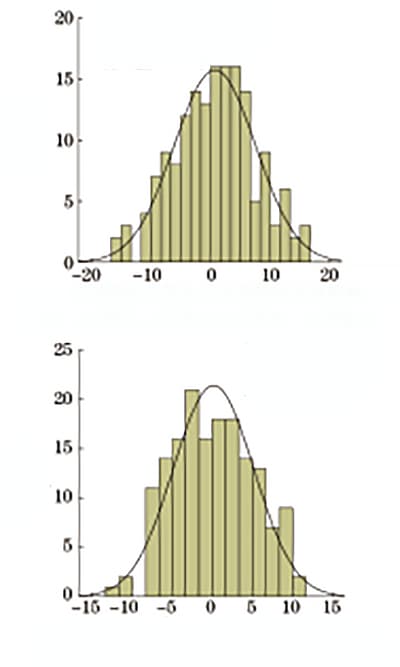
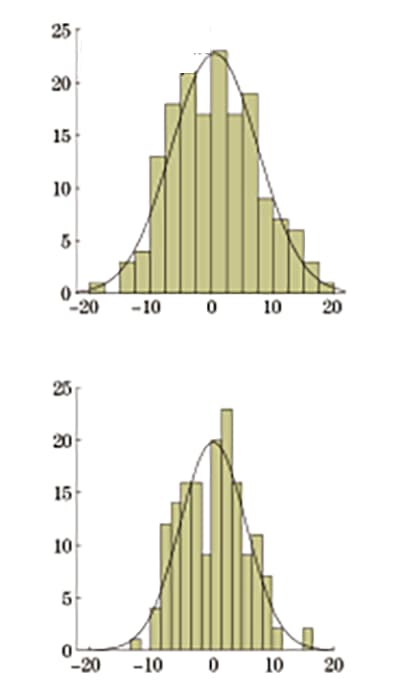
The test results of the upper yield strength and tensile strength of the Q235 and Q345 steel plates were statistically analyzed, and the distribution frequency is depicted in Figure 1.
Fig. 1 Strength Distribution Frequency of Q235 Steel Plate and Q345 Steel Plate
As shown in Figure 1, the upper yield strength range of the Q235 steel plate is 261 to 382 MPa, and the tensile strength range is 404 to 497 MPa. The upper yield strength range of the Q345 steel plate is 345 to 477 MPa, and the tensile strength range is 473 to 607 MPa.
The intensity frequency distribution is approximately normal, and the test results are in line with daily inspection data, indicating that the samples are highly representative.
2. Test results and analysis
The test samples were collected and processed according to the standard requirements, and underwent Rockwell hardness, Vickers hardness, Brinell hardness, and tensile tests.
To perform the regression analysis of the hardness and strength test results, the least square method was used, and SPSS software was employed.
2.1 Correlation between Rockwell hardness and strength
2.1.1 Rockwell hardness test results and analysis
The surface of the sample was ground using a grinder to ensure it was flat and smooth. The B scale was selected, and the instrument was calibrated using a standard hardness block. The Rockwell hardness test was performed in accordance with the requirements of GB/T 230.1-2018 Metallic Materials Rockwell Hardness Test Part 1: Test Method. Three points were measured for each sample, and the average value was taken.
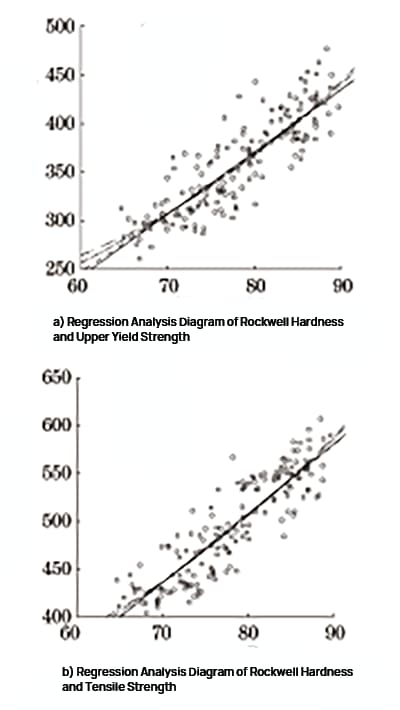
Fig. 2 Regression Analysis of Rockwell Hardness and Strength
SPSS software was used to perform linear regression, quadratic regression, power regression, and exponential regression analysis on Rockwell hardness, upper yield strength, and tensile strength. The regression analysis diagram is depicted in Figure 2, and the results of the regression analysis are presented in Table 1 and Table 2.
Table 1 Regression Model Data of Rockwell Hardness and Upper Yield Strength
Equation
Model Summary
Model parameter
R2
F
Significance P
constant
b1
b2
Linear quadratic exponent
0.736
446.897
0.000
-143.077
6.426
0.081
0.741
227.290
0.000
341.852
-6.141
0.740
456.461
0.000
0.828
1.392
0.744
464.965
0.000
86.806
0.018
Table 2 Regression Model Data of Rockwell Hardness and Tensile Strength
Equation
Model Summary
Model parameter
R2
F
Significance P
constant
b1
b2
Linear quadratic exponent
0.780
565.900
0.000
-71.394
7.241
0.074
0.783
286.412
0.000
372.980
-4.274
0.778
560.887
0.000
3.477
1.137
0.782
574.207
0.000
155.315
0.015
As indicated by Table 1 and Table 2, Rockwell hardness has a strong correlation with strength, and the correlation with tensile strength is stronger compared to upper yield strength.
Out of the four regression models between Rockwell hardness and strength, all have a significance P less than 0.05, and a close goodness of fit R2.
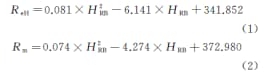
Given that the conversion relationship between Rockwell hardness and tensile strength of low carbon steel specified in the standard is similar to the polynomial model, it is recommended to use the quadratic model for conversion.
The formula after fitting is:
Where: ReH is the upper yield strength; Rm is the tensile strength; HRB is Rockwell hardness.
2.1.2 Relative deviation analysis of conversion results
Based on the fitted quadratic regression model, the relative deviations between the converted values of upper yield strength and tensile strength and the results from the tensile test were calculated and statistically analyzed. The sample size was 162, and the results are presented in Table 3.
The relative deviations follow a normal distribution, and the frequency distribution is shown in Figure 3.
Table 3 Statistical Table of Relative Deviation from Rockwell Hardness to Strength
Statistical items
Minimum value
Maximum
Average deviation
Standard reference
Relative deviation of upper yield strength conversion value
-16.56
+16.61
±5.46
6.84
Relative deviation of converted tensile strength
-13.31
+11.16
±4.12
5.03
Fig. 3 Relative deviation from Rockwell hardness to strength
2.1.3 Comparison with national standard conversion value
Figure 4 depicts a comparison of the conversion value of tensile strength specified in the standard, the conversion value of the fitted quadratic regression formula, and the scatter plot of the corresponding relationship between Rockwell hardness and tensile strength, all on the same chart.
Fig. 4 Comparison Chart of Tensile Strength Converted by Rockwell Hardness
As observed from Figure 4, the overall trend of the three curves is consistent. The conversion value of tensile strength given in GB/T 1172-1999 is similar to that of the author, with an average deviation of 2.7% and a maximum deviation of 5.7% within the range of 370 to 630 MPa.
However, the conversion value of tensile strength given in GB/T 33362-2016 is lower for Q235 steel (with tensile strength in the range of 370 to 500 MPa) and higher for Q345 steel (with tensile strength in the range of 470 to 630 MPa).
2.2 Correlation between Vickers hardness and strength
2.2.1 Vickers hardness test process and result analysis
The surface of the sample was polished using a grinder, and the instrument was calibrated with a standard hardness block. The Vickers hardness test was performed according to the requirements of GB/T 4340.1-2009 Metallic Materials Vickers Hardness Test Part 1: Test Method. Three points were measured for each sample, and the average value was taken.
SPSS software was used to perform linear regression, quadratic regression, power regression, and exponential regression analysis on Vickers hardness, upper yield strength, and tensile strength. The regression analysis diagram is depicted in Figure 5, and the results of the regression analysis are presented in Table 4 and Table 5.
Table 4 Regression Model Data of Vickers Hardness and Upper Yield Strength
Equation
Model Summary
Model parameter
R2
F
Significance P
constant
b1
b2
Linear quadratic exponent
0.727
426.980
0.000
-9.332
2.530
0.002
0.728
212.272
0.000
27.358
2.020
0.731
433.768
0.000
2.215
1.021
0.731
435.083
0.000
126.740
0.007
Fig. 5 Regression Analysis of Vickers Hardness and Strength
Table 5 Regression Model Data of Vickers Hardness and Tensile Strength
Equation
Model Summary
Model parameter
R2
F
Significance P
Constant
b1
b2
Linear quadratic exponent
0.753
486.507
0.000
84.099
2.818
0.002
0.753
241.944
0.000
133.182
2.136
0.748
475.262
0.000
8.189
0.823
0.751
483.330
0.000
213.597
0.006
As indicated by Table 4 and Table 5, Vickers hardness has a strong correlation with strength, and the correlation with tensile strength is stronger compared to upper yield strength.
Out of the four regression models between Vickers hardness and strength, all have a significance P less than 0.05, and a close goodness of fit R2.
Given that the conversion relationship between Vickers hardness and tensile strength of low carbon steel specified in the standard is close to a linear relationship, it is recommended to use the linear relationship for conversion.
The formula after fitting is:
Where: HV is Vickers hardness.
2.2.2 Relative deviation analysis of conversion results
Based on the fitted linear regression model, the relative deviations between the converted values of upper yield strength and tensile strength and the results from the tensile test were calculated and statistically analyzed. The sample size was 162, and the results are presented in Table 6.
The relative deviations follow a normal distribution, and the frequency distribution is shown in Figure 6.
Table 6 Statistical Table of Relative Deviation from Vickers Hardness to Strength
Statistical items
Minimum value
Maximum
Average deviation
Standard reference
Relative deviation of upper yield strength conversion value
-19.30
+17.55
±5.75
7.09
Relative deviation of converted tensile strength
-12.32
+15.83
±4.88
5.44
Fig. 6 Relative deviation of Vickers hardness converted to strength
2.2.3 Comparison with national standard conversion value
Figure 7 depicts a comparison of the conversion value of tensile strength specified in the standard, the conversion value of the linear regression formula obtained by the author, and the scatter plot of the corresponding relationship between Vickers hardness and tensile strength, all on the same chart.
Fig. 7 Comparison Chart of Tensile Strength Converted by Vickers Hardness
As observed from Figure 7, the overall trend of the three curves is consistent. The conversion value of tensile strength specified in GB/T 1172-1999 is very close to the conversion value obtained by the author. Within the range of 370 to 630 MPa, the difference between them increases slightly with an increase in hardness value, with an average deviation of 1.2% and a maximum deviation of 3.3%. However, the conversion value of tensile strength given in GB/T 33362-2016 is generally lower.
2.3 Correlation between Brinell hardness and strength
The surface of the sample was polished using a grinder to ensure a surface roughness not greater than 1.6 μm. The instrument was calibrated with a standard hardness block, and the Brinell hardness test was performed according to the requirements of GB/T 231.1-2018 Metallic Materials Brinell Hardness Test Part 1: Test Method. A cemented carbide indenter with a diameter of 10 mm was used, and the test force was 29.42 kN. Three points were measured for each sample, and the average value was taken.
SPSS software was used to perform linear regression, quadratic regression, power regression, and exponential regression analysis on Brinell hardness, upper yield strength, and tensile strength. The regression analysis diagram is depicted in Figure 8, and the results of the regression analysis are presented in Table 7 and Table 8.
Fig. 8 Regression Analysis of Brinell Hardness and Strength
Table 7 Regression Model Data of Brinell Hardness and Upper Yield Strength
Equation
Model Summary
Model parameter
R2
F
Significance P
constant
b1
b2
Linear quadratic exponent
0.756
495.403
0.000
-59.965
2.846
-0.001
0.758
246.186
0.000
-86.188
3.205
0.757
497.365
0.000
1.048
1.168
0.756
494.881
0.000
110.318
0.008
Table 8 Regression Model Data of Brinell Hardness and Tensile Strength
Equation
Model Summary
Model parameter
R2
F
Significance P
constant
b1
b2
Linear quadratic exponent
0.887
1253.313
0.000
-2.613
3.377
-0.001
0.888
631.852
0.000
-225.666
6.424
0.889
1286.205
0.000
3.204
1.009
0.886
1238.834
0.000
179.073
0.007
As indicated by Table 7 and Table 8, Brinell hardness has a strong correlation with strength, and the correlation with tensile strength is stronger compared to upper yield strength.
Out of the four regression models between Brinell hardness and strength, all have a significance P less than 0.05, and a close goodness of fit R2.
Given that the conversion relationship between carbon steel Brinell hardness and tensile strength specified in the standard is close to a linear relationship, it is recommended to use a linear relationship for conversion.
The fitted formula is:
Where: HBW is Brinell hardness.
2.3.2 Relative deviation analysis of conversion results
According to the fitted linear regression model, the relative deviations between the converted values of upper yield strength and tensile strength and the tensile test results are calculated respectively, and the relative deviations are statistically analyzed.
The statistics are 162, and the results are shown in Table 9.
The relative deviations are basically normal distribution, and the frequency distribution is shown in Fig. 9.
Table 9 Statistical Table of Relative Deviation from Brinell Hardness to Strength
Statistical items
Minimum value
Maximum
Average deviation
Standard reference
Relative deviation of upper yield strength conversion value
-16.78
+18.67
±5.38
6.75
Relative deviation of converted tensile strength
-9.25
+8.55
±2.89
3.59
Fig. 9 Relative deviation of Brinell hardness converted to strength
2.3.3 Comparison with national standard conversion value
In the standard GB/T 1172-1999, the ratio of test force to indenter ball diameter of Brinell hardness test is 10.
The author’s test is carried out according to GB/T 231.1-2018. With reference to the provisions of the standard, the ratio of test force to indenter ball diameter is 30.
Therefore, it is no longer compared with GB/T 1172-1999 in comparison with the national standard conversion value.
The standard conversion value of tensile strength given in GB/T 33362-2016, the conversion value of the linear regression formula fitted by the author, and the scatter plot of the corresponding relationship between Brinell hardness and tensile strength are compared on the same chart, as shown in Fig. 10.
Fig. 10 Comparison Chart of Tensile Strength Converted by Brinell Hardness
It can be seen from Fig. 10 that the conversion value of tensile strength given in GB/T 33362-2016 almost coincides with the regression curve of tensile strength fitted by the author, with an average deviation of 0.4% and a maximum deviation of 1.2% within 370-630MPa.
In recent years, the rapid development of various portable hardness testers has brought great convenience to on-site testing.
At present, many types of portable Rockwell hardness tester and portable Brinell hardness tester can be purchased in the market.
The equipment is portable, simple to operate, fast to measure, and the detection accuracy also meets the requirements of national standards, which is suitable for on-site engineering detection.
There is also various portable processing equipment for sample surface treatment, which can meet the test requirements.
Therefore, it is feasible to use Rockwell hardness and Brinell hardness to calculate the steel strength in the field inspection of steel structures.
3. Conversion of hardness to strength for ferrous metals (GB/T 1172-1999)
(1) Rockwell hardness, Vickers hardness and Brinell hardness show good correlation with strength. Based on material test, the conversion formula of Rockwell hardness, Vickers hardness and Brinell hardness and strength is obtained, and the relative deviation of conversion is within the allowable range of the project.
The relative deviation between Brinell hardness and tensile strength is obviously lower than that of Rockwell hardness and Vickers hardness.
(2) The converted tensile strength of Rockwell hardness given in GB/T 33362-2016 is low for Q235 steel and high for Q345 steel.
The converted tensile strength of Vickers hardness is slightly lower.
The converted tensile strength of Brinell hardness is consistent with the test results.
The values of tensile strength converted by Rockwell hardness and Vickers hardness given in GB/T 1172-1999 are close to the test results.
(3) Combined with the existing portable hardness testing instruments and sample processing equipment, the use of Rockwell hardness and Brinell hardness to calculate the strength of steel is operable in practical projects and can be applied to engineering practice.
As the founder of MachineMFG, I have dedicated over a decade of my career to the metalworking industry. My extensive experience has allowed me to become an expert in the fields of sheet metal fabrication, machining, mechanical engineering, and machine tools for metals. I am constantly thinking, reading, and writing about these subjects, constantly striving to stay at the forefront of my field. Let my knowledge and expertise be an asset to your business.
Have you ever wondered how the hidden process of heat treatment transforms ordinary carbon steel into a versatile material for mechanical parts? This blog delves into the fascinating world of…
Why do tiny impurities in steel hold such importance? These non-metallic inclusions, though minute, profoundly influence steel's properties and usability. This article delves into their origins, classifications, and the advancements…
What hidden danger could cause a steel structure to fail without warning? Hydrogen-induced cracking (HIC) is a critical issue affecting many industries, where hydrogen atoms infiltrate steel, leading to embrittlement…
What makes 17Cr2Ni2MoA and 18Cr2Ni4WA steels distinct in the world of gear manufacturing? This article dives into the nuances of these two alloy steels, comparing their chemical compositions, mechanical properties,…
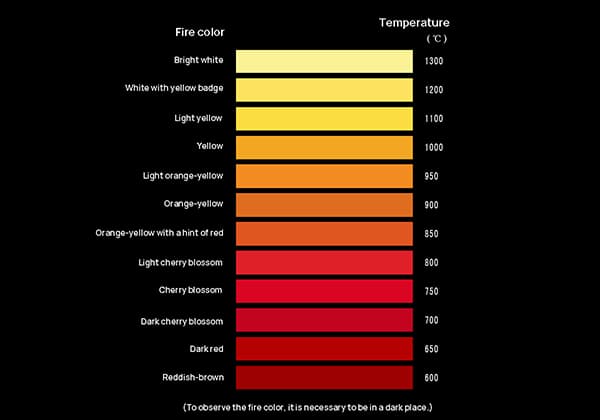
Have you ever marveled at the mesmerizing colors of heated steel? The vibrant reds, oranges, and yellows tell a fascinating story about temperature. In this article, we'll explore the science…
Ever wondered why stainless steel 304 is so resilient? This article delves into the critical role of chromium, explaining how it enhances corrosion resistance and longevity. Learn about the specific…
Imagine a world without steel plates. From the car you drive to the bridges you cross, these unassuming slabs form the backbone of modern infrastructure. In this article, we unravel…
Steel is a fundamental material that shapes our modern world, from towering skyscrapers to intricate machinery. But what makes steel so versatile and essential? This article dives into the science…