Exploring Mechanical Properties of Materials Under Static Loads
What happens when a steel beam buckles or a concrete column cracks under pressure? Understanding the mechanical properties of materials under static loads is crucial for engineers to design safe and reliable structures. This article dives into how materials like metals and composites behave when subjected to forces such as compression, bending, shear, and torsion. Readers will gain insights into essential testing methods, the principles behind these tests, and how the results inform the engineering process to prevent structural failures.
The Compression Test is a method used to determine the mechanical properties of materials under static axial pressure. It is one of the fundamental techniques for evaluating the mechanical properties of materials.
The test is mainly used to measure the yield point of metals under uniaxial compression at room temperature and the compressive strength of brittle materials.
Compressibility is defined as a material’s ability to resist deformation and damage under compressive stress.
In engineering, many components are subjected to compressive loads, such as columns in large structures, crane supports, and compression bolts in steel rolling mills. Hence, the raw materials used in these components must undergo compression testing to ensure their suitability.
1.2 Concept
Compressive Yield Strength: This is the stress at which a metal material exhibits yielding during a compression test, characterized by continuous deformation without an increase in force.
Upper Compressive Yield Strength: This is the highest compressive stress experienced by the specimen before there is a drop in force due to yielding.
Lower Compressive Yield Strength: This is the minimum compressive stress experienced during the yielding period, excluding any instantaneous effects.
Tensile Strength: For brittle materials, this is the maximum compressive stress experienced by the sample during compression until failure.
Compressive Elastic Modulus: This is the ratio of axial compressive stress to axial strain within the range where there is a linear proportional relationship between axial compressive stress and axial strain during the test.
1.3 Test equipment, instruments and samples
Equipment and Instruments: The following equipment and instruments are required for a compression test:
A Universal Testing Machine for materials.
A Vernier Caliper for precise measurement.
The compression specimens used in the test are usually cylindrical in shape, with circular or square cross-sections.
During the compression test, friction between the two ends of the specimen and the indenter of the testing machine can constrain the lateral deformation of the specimen. The shorter the specimen, the greater the influence of this constraint. However, if the specimen is too long, it can easily result in longitudinal bending and instability.
1.4 Mechanical analysis of compression test
Mild steel
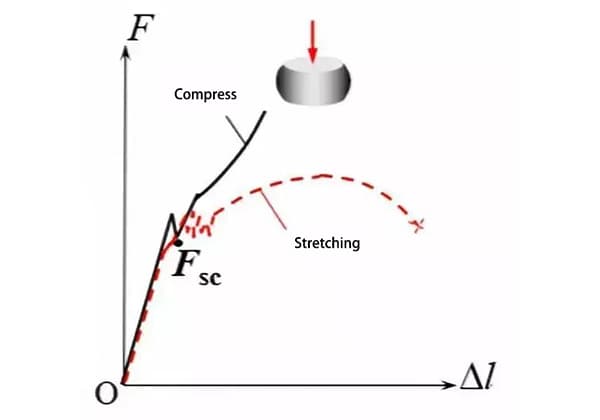
The low-carbon steel sample is mounted on the testing machine and subjected to an axial force, F. The deformation of the sample is represented by Δl. The relationship between the two is depicted in the accompanying figure.
Comparison of compression-stretch curves of low-carbon steel
Low-carbon steel undergoes three stages during compression: the elastic stage, the yield stage, and the strengthening stage. Unlike in tensile testing, low-carbon steel will not fracture due to compression deformation, instead it forms a “drum” due to the influence of friction at the upper and lower ends.
When the specimen diameter is the same, the elastic stages of the compression and tensile curves are nearly identical, and the yield points are similar.
Low-carbon steel is a plastic material. After yielding, plastic deformation increases rapidly and the cross-sectional area of the sample also increases. The increased area allows the sample to bear more load, so only the yield limit can be measured, but not the strength limit.
Cast iron
The cast iron sample is mounted on the testing machine and subjected to an axial force, F. The deformation of the sample is represented by Δl. The relationship between the two is depicted in the accompanying figure.
The compressive strength of gray cast iron is three to four times greater than its tensile strength. During compression, cast iron fractures under small deformation, forming a slightly “drum shaped” structure with a section normal inclined at an angle of 45-55 degrees from the axis.
When the specimen diameters are the same, the compression and tensile curves of cast iron differ significantly, with the compressive strength being much higher than the tensile strength.
2. Bending test
2.1. Overview
The property of materials under bending load is referred to as the bending property.
A bending test is performed to assess a material’s performance when subjected to a bending load.
Many machine components, such as tools, beams, axles, etc., made from brittle materials, operate under bending loads. This test is mainly used to determine the bending strength of brittle and low plastic materials, such as cast iron, high carbon steel, and tool steel, and to indicate the plasticity index’s deflection.
The bending test can also be utilized to verify the material’s surface quality.
The test is usually carried out at room temperature and is therefore known as a cold bending test.
2.2 Concept
Deflection: Linear displacement of the centroid of a cross section in the direction perpendicular to the axis during a bending deformation.
Bending Stress: The stress generated during bending.
Bending Strain: A slight change in the unit length on the outer surface of the sample span center during bending.
Bending Modulus of Elasticity: The ratio of bending stress to strain within the range where there is a linear proportional relationship between the two.
Bending Strength: The maximum bending stress reached before or at the specified deflection value.
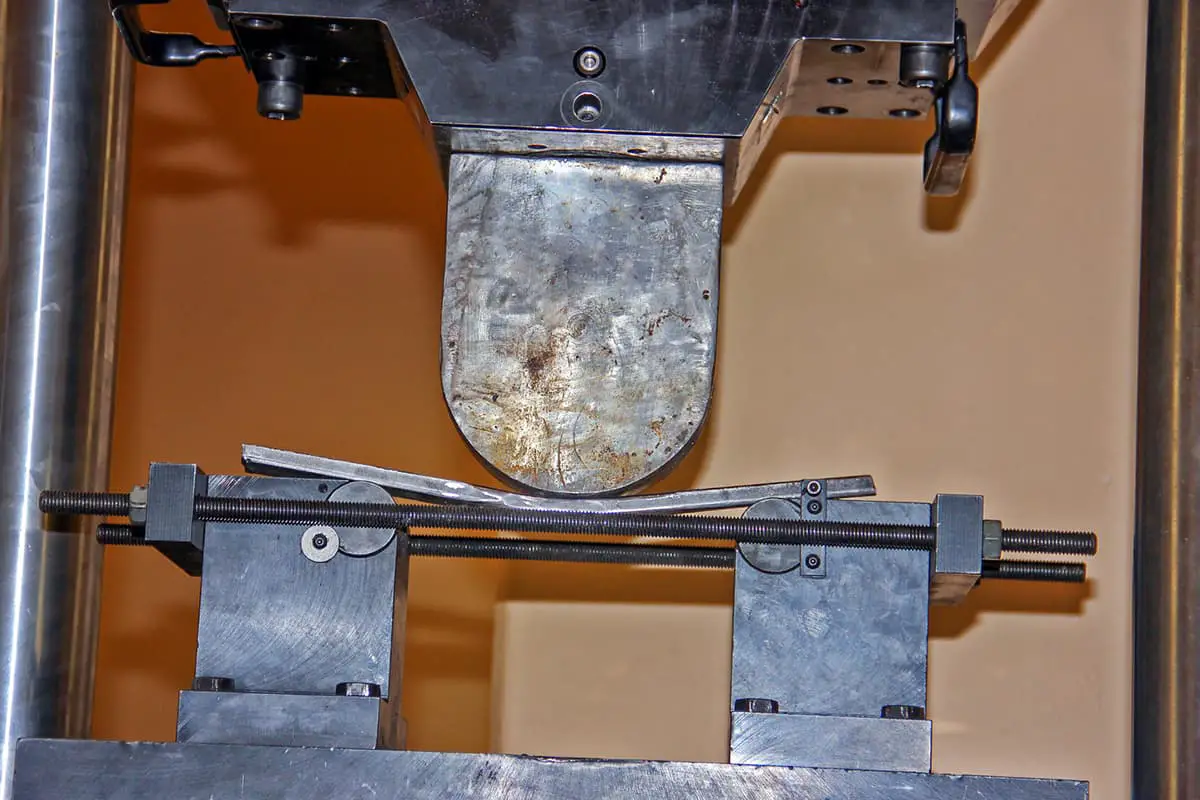
2.3 Bending test principle
In a bending test, a specimen with a specific shape and size is placed on supports with a certain span length (L) and a concentrated load is applied, causing the specimen to experience bending stress and deformation.
There are two types of bending tests: three-point bending and four-point bending. Three-point bending is the most widely used method.
2.4 Bending sample and test device
The shape of the cross-section of a bending test specimen can be round, square, rectangular, or polygonal, but it should conform to the specifications outlined in relevant product standards or technical agreements.
At room temperature, the specimen can be prepared through sawing, milling, planing, or other processing methods. The part of the specimen that is being tested must not have any indentations or scars.
The edges of the specimen should be smoothed by filing, and the radius should not be greater than 1/10 of the thickness of the specimen.
The bending test is typically conducted on a universal material testing machine or a press brake machine.
Common bending dies used in the test include roller type, V-type mold type, vise type, and plate type.
2.5 Mechanical analysis of bending test
The bending curve is a graphical representation of the relationship between the bending load obtained from a bending test and the bending deflection of the specimen.
The maximum normal stress on the surface of the tensile side during bending of the specimen can be calculated as follows: σ= M/W, where:
M is the maximum bending moment and can be calculated as follows:
In three-point bending, M=FLs/4, where F is the load, L is the span length, and s is the distance from the specimen’s neutral axis to the outer surface.
In four-point bending, M=Fa/2, where a is the distance between the two supports.
W is the bending section coefficient and can be calculated as follows:
For a round specimen with diameter d, W=π d3/32.
For a rectangular specimen with width b and height h, W=bh2/6.
2.6 Performance index
Bending Strength: The maximum stress a specimen can endure before breaking under bending, which is calculated using the elastic bending stress formula represented by the symbol σbb: σbb = Mb/W (where Mb is the bending moment at the point of fracture).
Gray cast iron has a higher bending resistance compared to its tensile strength.
Fracture Deflection: To determine the fracture deflection, the specimen is placed symmetrically on a bending test device with a deflectometer installed at the midpoint of the specimen. A constant bending force is applied until the specimen breaks, and the deflection at the midpoint of the span is measured at the moment of fracture.
3. Shear test
3.1 Overview
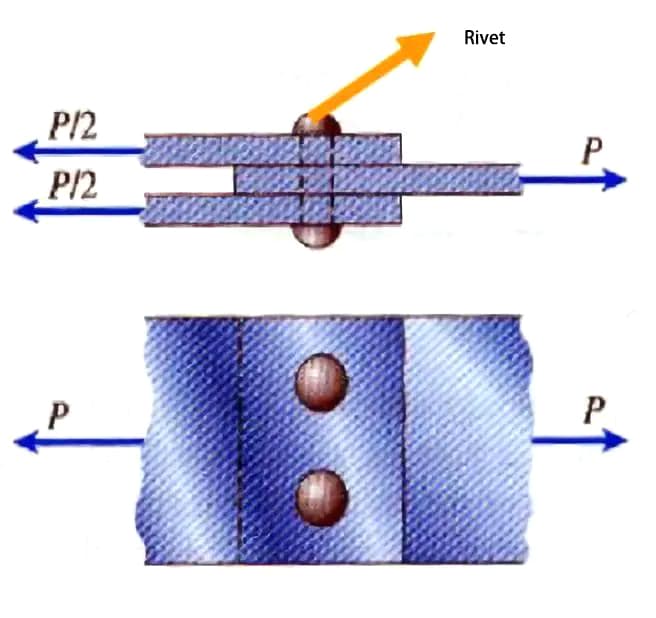
The Shear Test is performed to evaluate the shear strength of materials. It involves determining the maximum force at which the specimen experiences dislocation upon failure in shear.
Shear forces are common in various engineering structures such as bolts, pins, rivets, etc.
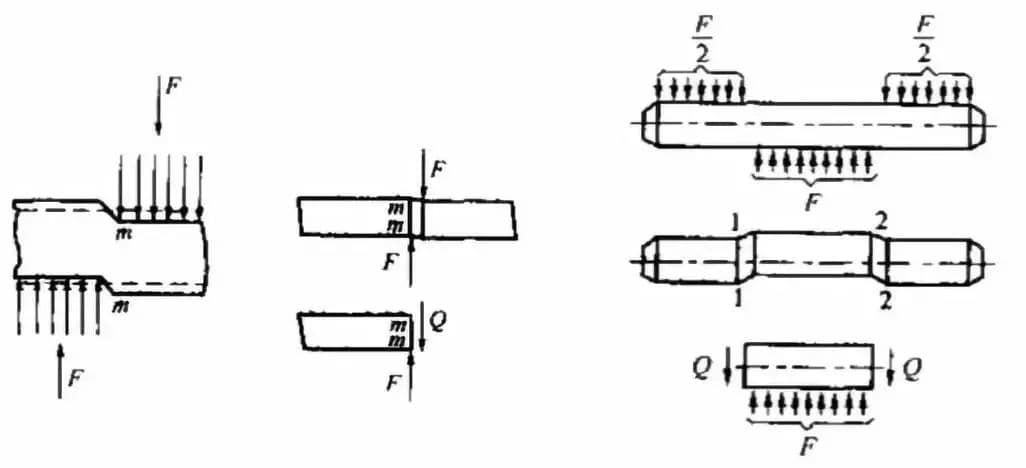
The resulting force of the load acting on two sides of the sample consists of a pair of forces with equal magnitude, opposite direction, and collinear action lines, as depicted in the illustration.
3.2 Classification of shear test
It is commonly divided into five categories: the single-shear test, the double-shear test, the punching test, the slit-shear test, and the composite steel plate shear test.
3.3 Sample and test device
Determining the Shear Specimen: The shear specimen is selected based on the shear test method and its corresponding fixture.
Cylindrical Sample: The diameter and length of the sample are selected based on the fixture, with common diameters being 5, 10, or 15 mm.
Punching Plate Sample: When it is not possible to create a cylindrical sample from a thin plate, a punching shear sample can be used. The thickness of the plate sample should typically be less than 5mm.
Shear Sample of Actual Parts: Actual parts such as rivets or bolts can also be used as the shear specimen.
Test Setup:
3.4 Determination of shear properties
The room temperature shear test must be carried out at a temperature range of 10℃ to 35℃.
For various samples, select the suitable apparatus. During installation, it must align with the centerline of the indenter of the testing equipment and should not be off-center. The shear test speed must be greater than or equal to 15mm/min, while the high-temperature shear test speed must be greater than or equal to 5mm/min.
For the high-temperature shear test, the temperature rise time must be no less than 1 hour and the heat retention time must be between 15-30 minutes.
3.5 Processing of shear test data
After cutting the specimen, record the maximum test force (F) during the shear test.
Calculate the shear strength (τb) in MPa using the following formula:
Single shear strength: τb=F/S0 (S0 — original cross-sectional area of the sample, mm2)
Double shear strength: τb=F/2S0=2F/(πd2)(S0 — original cross-sectional area of the sample, mm2)
The Torsion Test is a method used to evaluate a material’s resistance to twisting forces or torque. It is a fundamental method for testing the mechanical properties of materials.
The test involves applying a torque T to a sample, measuring both the torque T and the corresponding angle of twist φ, and plotting a torsion curve. The sample is typically twisted until it fractures, and the torsional mechanical properties of the metal material are determined from the resulting data.
In various industries such as mechanics, petroleum, and metallurgy, there are many instances where mechanical components are subjected to torsional loads, such as shafts and springs.
Characteristic
The high flexibility coefficient of stress in torsion makes it useful for measuring the brittleness of materials under tension. For example, this can be applied to the study of the plasticity of quenched and low-temperature tempered tool steel.
In a torsion test, the plastic deformation of the cylinder is consistent along its entire length, and the section and gauge length of the test piece remain constant without any necking phenomenon during static tension.
Torsion testing is effective in differentiating between normal and cutoff fracture modes in materials. For plastic materials, the fracture surface is perpendicular to the axis of the specimen and exhibits a flat surface with plastic deformation traces in a swirling pattern.
Torsion testing is sensitive to metal surface defects, as it reveals the distribution of stress and strain on the cross-section of the specimen. Thus, it can be used to evaluate the surface quality of heat-treated workpieces and the effects of various surface strengthening processes.
In torsion testing, the specimen is subjected to high shear stress, making it a useful tool for studying non-simultaneous initial plastic deformation, such as elastic aftereffects, elastic hysteresis, and internal friction.
4.2 Application of torsion test
The torsion test can be utilized to determine all mechanical property indices related to shear deformation and fracture of both plastic and brittle materials. It possesses advantages that cannot be matched by other methods of mechanical property testing.
Torsional fracture morphology
(a – cut-off fracture, b – normal fracture, c – layered fracture)
The fracture surface of plastic material is perpendicular to the axis of the test piece and has a flat appearance with swirling plastic deformation traces, as seen in Figure a. This type of fracture is caused by shear stress.
In contrast, the fracture surface of brittle material is inclined at approximately 45 degrees to the axis of the test piece and has a spiral shape, as shown in Figure b.
When the axial cutting resistance of the material is weaker than its transverse cutting resistance, layered or wood chip fractures may occur during torsional fracture, as depicted in Figure c.
By examining the characteristics of the fracture surface, it is possible to determine the cause of the fracture and evaluate the relative strengths of the material’s torsional strength and tensile (compressive) strength.
4.3 Principle of torsion test
During the test, as the torque increases, the sections at both ends of the gauge length of the test piece continuously rotate relative to each other, resulting in an increase in the torsional angle.
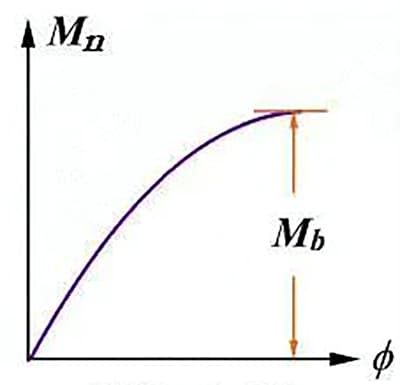
The test machine’s drawing device can be used to create a Mn-φ Curve (also known as a torsion diagram).
Based on the unique properties of materials, the torsion curve can be classified into two typical types: low-carbon steel and cast iron.
Torsion curve
The torsion diagram is comparable to the stress-strain curve obtained from the tensile test, as the shape of the specimen remains unchanged during torsion and the deformation is consistent throughout.
Even when it reaches the plastic deformation stage, the torque continues to increase as the deformation increases, until the specimen eventually breaks.
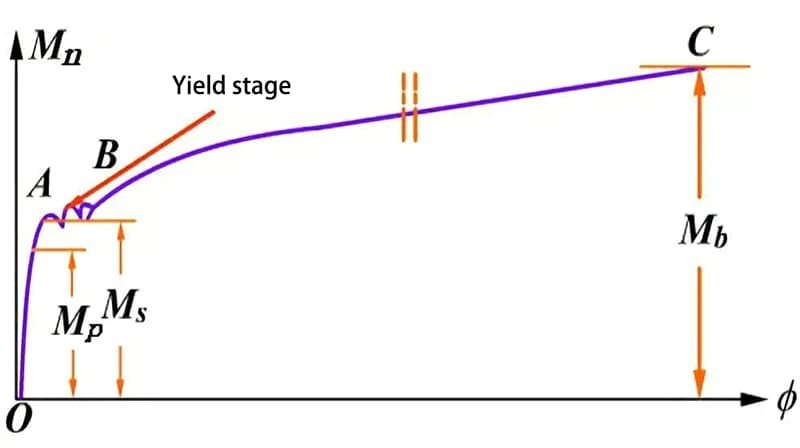
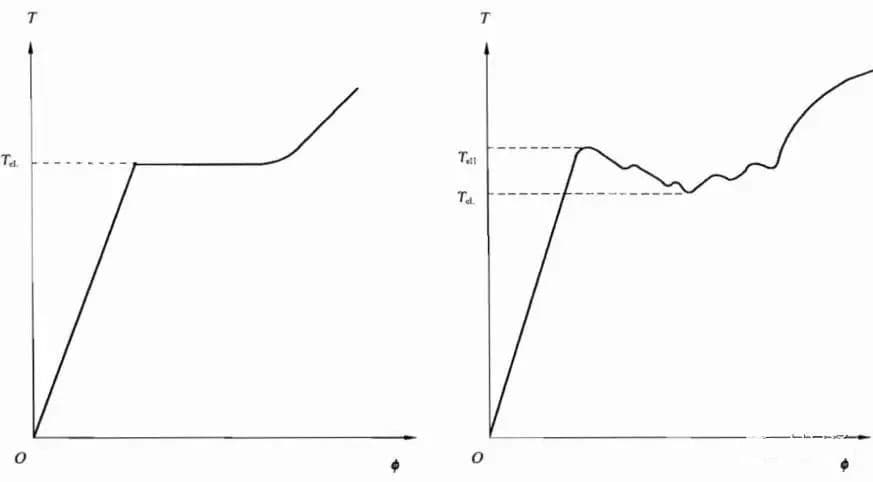
Torsion curve of mild steel
Elastic phase OA
At point D, when the curve is reached in a weak area of the test piece (where the material is inconsistent or has flaws), there is a significant increase in deformation, a sharp decrease in the effective cross section, and necking occurs.
Subsequently, the axial deformation of the specimen is primarily focused at the necking location, and the specimen eventually breaks at that point.
When the applied torque remains within the elastic range, the deformation is elastic and the Mn-φ curve appears as a straight line.
The corresponding torque, Mp, is reached when the shear stress at the edge reaches the shear yield limit.
The stress in the section is evenly distributed and the highest shear stress is found on the surface, i.e. τ max = Mn/Wn.
Torsion curve of mild steel
Distribution of stress and strain during elastic deformation
Yield stage AB
When the elastic limit is exceeded, the specimen begins to yield in a gradual manner, starting from the surface and spreading to the center of the circle.
As a result, the Mn-φ curve begins to bend, the plastic zone in the cross section expands towards the center of the circle, and the stress on the cross section becomes non-linear.
Once the entire specimen has yielded, a yield plateau appears on the Mn-φ curve.
The minimum yield torque, as indicated by the active pointer, is recorded at this point as Ms.
When the applied torque remains within the elastic limit, the deformation is elastic and the Mn-φ curve remains a straight line.
When the shear stress at the edge reaches the shear yield limit, the corresponding torque is Mp.
The stress on the section is distributed linearly, and the shear stress on the surface is the largest. I.e τ max= Mn/ Wn
yield strength τs=(3/4)(Ms/Wn)
Strengthening stage BC
Once the yield stage is exceeded, the φ curve begins to rise again, indicating that the material has regained its ability to resist deformation. In other words, the torque required to continue deforming the material must continue to increase.
Low carbon steel has a prolonged strengthening stage, but there is no necking before fracture occurs.
Torsional strength limit τb=(3/4)(Mb/Wn)
Torsion curve of mild steel
Torsion curve of cast iron
When cast iron is subjected to a certain amount of loading, the Mn-φ curve deviates from a straight line until it reaches breaking point. This indicates that the plastic deformation of cast iron is more pronounced during torsion compared to tension.
The strength limit, referred to as τb, is defined as the maximum shear stress at the point of fracture in cast iron.
τb=(3/4)(Mb/Wn)
Cast iron torsion curve
4.4. Specimen for torsion test
According to current standards, samples can be classified into two types: cylindrical and tubular.
It is advisable to use cylindrical samples with a diameter of 10 mm, gauge distances of 50 mm and 10 mm, and parallel lengths of 70 mm and 120 mm, respectively.
If specimens of other diameters are used, their parallel length should equal the gauge length plus twice the diameter.
The parallel length of tubular specimens should be equal to the gauge length plus twice the outer diameter.
4.5 Instrument and equipment for torsion test
Torsion testing machine
Various types of mechanical or electronic torsion testing machines are acceptable.
The testing machine’s torque indication relative error must not exceed ±1%, and this must be verified regularly by the metrology department.
During the test, one of the two chucks of the testing machine must be able to move along the axis freely without applying additional axial force on the sample, and both chucks must remain coaxial.
The testing machine must be capable of continuously applying torque to the sample without any impact or vibration, and maintain a constant torque for 30 seconds.
Torsion meter
Different types of torsion meters, including mirror type, dial type, and electronic type, are permitted for measuring torsion angle.
It is suggested to use electronic type torsion meters.
Test conditions: The test must be performed at room temperature, which is between 10-35 ℃.
Torsion speed: The speed must range from 3° to 30° per minute before yielding, and must not exceed 720° per minute after yielding.
The change in speed must not have any effect.
(1) Determination of shear modulus
Graphic Method:
The torque-angle curve must be recorded using an automatic recording method.
The increment of torque and the increment of angle must be read from the elastic linear segment of the curve.
Torque-torsion angle curve
Step-by-Step Loading Method:
Within the range of the elastic straight section, the sample must be loaded with a minimum of five equal torques.
The torque and corresponding torsional angle at each stage must be recorded. The average torsional angle increment for each stage must be calculated, and the shear modulus (G) must be calculated using the formula in the graphic method.
(2) Determination of specified non-proportional torsional strength
The torque-torsion angle curve is recorded using an automatic recording method.
The cross-torsion angle axis of the elastic straight line segment on the curve is extended to point O. The OC segment is intercepted, and a parallel line CA is drawn from the elastic straight line segment through point C to point A. The torque corresponding to point A is Tp.
(3) Determination of upper and lower yield strength
The measurement shall be performed using either the diagram method or the pointer method.
During the test, either the automatic recording method will be used to record the torsion curve, or the torque dial pointer of the testing machine will be directly observed.
The upper yield torque is defined as the maximum torque before the first drop, and the lower yield torque is defined as the minimum torque in the yield stage, excluding the initial instantaneous effect.
Upper yield strength: τeH=TeH/W
Lower yield strength: τeL=TeL/W
(4) Determination of torsional strength
Apply continuous torque to the sample until it breaks.
Record the maximum torque of the sample before it twists, either from the recorded torsion curve or from the torque dial of the testing machine, and then calculate the torsional strength using the appropriate formula.
The torsional strength is calculated as follows:
τm = Tm / W
Where:
τm = Torsional strength
Tm = Maximum torque
W = Section coefficient
4.7 Fracture analysis of the sample
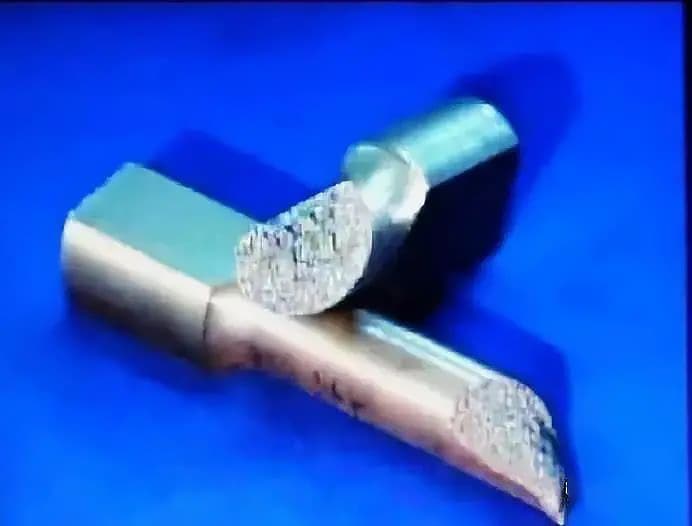
Carbon steel fracture shape: plane fracture
It demonstrates that the fracture is a result of shear stress.
The evidence of convoluted plastic deformation can be observed on the section, which is a characteristic of a ductile fracture.
The strength limit at the point of fracture is referred to as τb.
Cast iron fracture shape: 45 ° spiral fracture
It is indicated that the fracture is caused by the maximum tensile stress.
However, the maximum tensile stress breaks before the maximum shear stress reaches its strength limit, which suggests that cast iron has weaker tensile strength compared to its shear strength.
During pure torsion, the surface of the round specimen experiences pure shear stress, and two principal stresses, σ1 and σ3, are applied to the spiral surface at angles of ± 45 º to the rod axis and are equal to the absolute value of the maximum shear stress τmax.
Therefore, the fracture angle of the sample reveals whether the material is experiencing tensile or shear stress and the strength of the material’s own tensile and shear resistance.
The surface of the round specimen is in the state of pure shear stress during pure torsion
5. Hardness test
5.1 General
Hardness refers to the ability of solid materials to resist local deformation, including plastic deformation, indentation, and scratch, indicating the resistance of the material to these actions.
Hardness is not a straightforward physical property, but rather a comprehensive indicator of the mechanical properties of a material, such as its elasticity, plasticity, strength, and toughness.
For instance, the scratch hardness test measures the resistance of metal to cracking, while the indentation hardness test assesses its resistance to deformation.
There is a correlation between hardness data and other mechanical properties, such as tensile strength, as both hardness and tensile strength are related to the plastic deformation that occurs during tension.
5.2 Hardness test method and classification
The hardness test is the most commonly used mechanical property test, which can be divided into two categories based on the type of stress applied: indentation and scratch.
In the indentation method, there are two subcategories based on the speed of force application: static force test and dynamic force test.
The widely used Brinell hardness, Rockwell hardness, and Vickers hardness tests are examples of static force tests, while Shore hardness, Leeb hardness, and hammering Brinell hardness tests are examples of dynamic force tests.
Scope of application of hardness measurement methods
Hardness measurement method
Scope of application
Brinell hardness test
Parts with coarse grains and uneven structure shall not be used for finished products. In the hardness test of iron and steel parts, cemented carbide ball indenters have been gradually used to measure the hardness of annealed parts, normalized parts, quenched and tempered parts, castings and forgings.
Rockwell hardness test
Hardness inspection of batch, finished products and semi-finished products. Parts with coarse grains and uneven structure shall not be used. It is divided into three types: A, B and C.
Surface Rockwell hardness test
Test the hardness of thin pieces, small pieces and the surface hardness of parts with thin or medium thickness hardening layer. N scale is generally used in hardness test of steel parts.
Vickers hardness test
It is mainly used to measure the hardness of small pieces and thin pieces, as well as the surface hardness of parts with shallow or medium thickness hardening layer.
Vickers hardness test under small load
Test the hardness of small pieces and thin pieces, as well as the surface hardness of parts with a shallow hardening layer. Measure the surface hardness gradient or hardened case depth of the case hardened parts.
Micro Vickers hardness test
Test the hardness of micro parts, extremely thin parts or microstructures, and the surface hardness of parts with extreme or extremely hard hardening layers.
Shore hardness test
It is mainly used for on-site hardness inspection of large parts, such as rolls, machine tool surfaces, heavy construction, etc.
Hardness test of steel files
On site hardness inspection for parts with complex shape and large pieces. 100% hardness inspection of batch parts. The hardness of the inspected surface shall not be lower than 40HRC.
Knoop hardness test
Test the hardness of micro parts, extremely thin parts or microstructures, and the surface hardness of parts with extremely thin or extremely hard hardening layers.
Leeb hardness test
On site hardness inspection for large parts, assembly parts, parts with complex shape, etc.
Ultrasonic hardness test
On site hardness inspection for large parts, assembly parts, parts with complex shape, thin parts, nitrided parts, etc.
Hammer blow Brinell hardness test
On site hardness inspection of normalized, annealed or quenched and tempered large pieces and raw materials.
Shore hardness is also known as the rebound method and can be further divided into three categories: indentation, elastic rebound, and scratch.
Hardness values of the same type can be converted, but only for the same material when comparing hardness values obtained from different methods.
Characteristics of Hardness Testing
The experimental method is straightforward and does not require sample processing.
The damage caused to the surface is minimal and falls within the category of “non-destructive” or micro-damage detection.
There is a correlation between hardness and other mechanical performance indexes under static load. For example, the strength value can be estimated from the hardness measurement.
The measurement range can vary from multiple grains to a single grain or even several atoms using a NanoIndenter.
5.3 Concept
Brinell Hardness (HB): A unit of measurement of a material’s resistance to permanent indentation deformation caused by the application of a test force through a cemented carbide ball indenter.
Knoop Hardness (HK): A unit of measurement of a material’s resistance to permanent indentation deformation caused by the application of a test force through a diamond cone indenter.
Shore Hardness (HS): Refers to the hardness expressed as the measured setback height of a striker pin (a small cone with a diamond drill tip) when it falls onto the surface of the tested material from a set height using the elastic rebound method.
Rockwell Hardness (HR): A unit of measurement of a material’s resistance to permanent indentation deformation caused by the application of a test force through a cemented carbide or diamond cone indenter, corresponding to a specific scale.
Vickers Hardness (HV): A unit of measurement of a material’s resistance to permanent indentation deformation caused by the application of a test force through a diamond pyramid indenter.
Leeb Hardness (HL): Refers to the hardness value calculated as the ratio of the rebound speed and impact speed of a punch 1mm from the surface of the sample when an impact body of specified quality impacts the surface of the sample at a set speed under elastic force.
Standard Block: Used for indirect inspection of indentation hardness testers, it has standard block materials with qualified indentation values.
5.4 Relationship between hardness and material tensile strength
The hardness of a metal is proportional to its tensile strength, as expressed by the equation: σb = kHB, where k is the proportional coefficient. The k values for different metal materials vary.
After undergoing heat treatment, the hardness and strength of a metal may change, but its k value remains largely unchanged. However, the k value is no longer constant after a metal undergoes cold deformation.
The k value for steel is approximately 3.3. It is important to obtain accurate strength data through direct measurement.
5.5 Brinell hardness
Principle: The hardness of a material is determined by using an indenter with a specific diameter to apply a test force onto the surface to be measured. The diameter of the indentation on the material’s surface is then measured after unloading for a specified period of time, and the hardness value is calculated.
Indenter: The indenter used for this measurement is either a hardened steel ball or a hard alloy steel ball.
The Brinell hardness test consists of three elements: load, indenter diameter, and holding time.
The representation of the Brinell hardness is represented as follows: 120HBS10/1000/30.
120 indicates the hardness value of 120.
The letter “S” refers to a quenched steel ball (while the letter “W” refers to a cemented carbide steel ball).
10 indicates the diameter of the pressure head, which is 10mm.
1000 indicates the load applied, which is 1000kgf.
30 indicates the holding time, which is 30s. It is worth noting that the holding time is generally not marked for values between 10 to 15 seconds.
Brinell hardness value is in kilogram force/mm2 (N/mm2);
The maximum possible value for Brinell hardness is HB650, and any value higher than this is not considered valid.
Advantages:
The indentation range is broad, providing a comprehensive evaluation of material hardness performance.
Test data is consistent, reproducible, and widely recognized.
Ideal for testing materials with large grain size, complex phase composition, and significant phase size.
Disadvantages:
Destructive testing method with deep indentation that cannot be performed on finished products’ surfaces.
The process is intricate, low in efficiency, and does not allow for continuous testing.
Brinell hardness test equipment
5.6 Rockwell hardness
Principle: The material surface is tested for hardness by pressing a diamond cone or quenched steel ball indenter into it under a test pressure F.
After being held for a specified time, the main test force is removed and the initial test force is maintained. The hardness value is then calculated using the residual indentation depth increment.
In actual measurement, the Rockwell hardness value can be easily read from the dial of the testing machine.
Note: The Rockwell hardness test requires a large load, so it is not suitable for measuring extremely thin samples or surface-hardened layers. For these cases, the surface Rockwell hardness measurement is recommended.
Advantages:
The operation is straightforward, fast, and efficient, with the ability to directly read the hardness value.
The small indentation size allows for measurement of finished products or thinner workpieces.
The test can measure the hardness of materials with varying hardness levels.
Disadvantages:
The small indentation size results in poor representativeness of the data.
The data repeatability is poor for materials with segregation or uneven structures.
Rockwell hardness data for different grades cannot be directly compared.
Indenter: The test uses either a diamond cone with a vertex angle of 120° or a quenched steel ball with a diameter of 1.588mm.
1-1: The position of the indenter with the initial load applied.
2-2: The position of the indenter after the addition of both the initial load and the main load.
3-3: The position of the ram after the removal of the main load.
he: The elastic recovery of the material after the removal of the main load.
Hardness scales
Scale
Indenter
Load (kg)
Purpose
A
diamond
60
HRA: less pressure and damage in hardness test of superhard alloy and thin steel plate penetrating the rigid surface layer
B
1/16 foot ball
100
HRB: soft stainless steel, nonferrous metals
C
diamond
150
HRC: Tungsten Carbide and Age Hardened Steel
D
diamond
100
HRD: Surface hardened parts
E
1/8 inch ball
100
HRE: cast iron, aluminum alloy, magnesium alloy, bearing and gold
F
1/16 inch ball
60
HRF: Cold gift metal sheet steel, annealed steel, brass
W – Type of indenter: W represents cemented carbide; S for steel ball
Rockwell hardness test equipment
5.7 Vickers hardness
Principle: The indenter is pressed into the surface of the sample under a static testing force. After holding it for a specified time, the testing force is removed, leaving a square and conical indentation on the surface of the sample.
Calculation of Indentation Area: The Vickers hardness is calculated by dividing the testing force by the indentation surface area.
Indenter – diamond material, square pyramid, face angle of 136 °
The Vickers hardness testing method offers the advantage of being able to select the testing force arbitrarily for materials with uniform hardness, as the hardness value remains unchanged. A cone with a 136° face angle is chosen for consistency in comparison with Brinell hardness indications.
Representation Method: The hardness value is represented by the number in front of “HV,” and the test force value is represented by the number following “HV.”
The standard holding time for the test is 10 to 15 seconds. If the holding time deviates from this range, it must be marked.
For example, “600HV30” indicates that the hardness value obtained using a 30 kgf test force and holding it for 10 to 15 seconds is 600.
“600HV30/20” indicates that the hardness value obtained using a 30 kgf test force and holding it for 20 seconds is 600.
Scope of Application: Vickers hardness tests can be applied to measure the hardness of metals, including low load Vickers hardness tests and micro Vickers hardness tests, depending on the size of the test force.
Vickers Hardness Test: This test is capable of measuring the hardness of all metals, excluding samples with very small and thin layers.
Low Load Vickers Hardness Test: This test is ideal for measuring the surface hardness of steel surface strengthening layers, chemical heat treatment surface layers, infiltration layers, transition layers, etc.
Micro Vickers Hardness Test: In addition to testing the hardness of products, this test method is widely used in metallography and material research.
Advantages:
Wide Range of Applications: The Vickers hardness test can measure materials ranging from very soft to very hard.
High Measurement Accuracy and Comparability: The test provides highly accurate and comparable hardness values.
Independence from Test Force: The hardness value obtained through the Vickers hardness test is independent of the test force used.
Disadvantages:
Tedious Measurement Procedure: The measurement process can be cumbersome and time-consuming.
Low Measurement Efficiency: The Vickers hardness test is not suitable for mass production or the measurement of inhomogeneous materials, as the efficiency of the test is low.
Vickers hardness test equipment
5.8 Microhardness
Microhardness testing involves applying a load of less than 0.2 kgf and is further divided into Micro Vickers and Micro Knoop hardness tests.
These tests can accurately measure the hardness of brittle materials like ceramics, glass, and agate with high sensitivity and are ideal for evaluating the work hardening degree of fine wires.
Metal materials and metallography research utilizes microhardness testing to determine the hardness of different phases in metals and alloys, analyze their impact on alloy properties, and provide a foundation for proper alloy design.
(2) Study of Metal Surface Layer Properties:
Studies of the properties of diffusion layers, such as carburized layers, nitrided layers, and metal diffusion layers, as well as research on the properties of surface-hardened layers are carried out. For instance, the metal surface is influenced by both mechanical and thermal processing.
(3) Study of Grain Inhomogeneity:
Research is also conducted on the inhomogeneity of grains.
(4) Hardness Measurement of Very Thin Metal Products:
Finally, microhardness testing is used to measure the hardness of extremely thin metal products.
5.9 Shore hardness
In the Shore hardness test method, a diamond punch of a specified shape is dropped from a fixed height h0 onto the surface of the sample. The punch then bounces up to a certain height h.
The Shore hardness value is calculated based on the ratio of h to h0, as the hardness of the material is proportional to the rebound height.
Note that Shore hardness is a dynamic force test method, different from the previous three static indentation methods.
Shore hardness tester
Sample Requirements:
For the sample to be tested, the following requirements must be met:
The mass of the sample must be at least 0.1kg and the thickness should generally be over 10mm.
The test area of the sample should be as large as possible.
The surface must be free of oxide scale and foreign dirt, and should not be magnetic.
Representation Method:
The hardness value is represented as follows:
The number before HS indicates the hardness value.
The number after HS indicates the type of hardness scale.
45HSC means the hardness value measured by a C-type hardness tester is 45.
45HSD means the hardness value measured by a D-type hardness tester is 45.
Advantages:
Simple operation and high efficiency
After the test, there is almost no indentation, and the test can be conducted on the finished product.
Disadvantages:
Low measurement accuracy
Poor repeatability
Not suitable for testing with high accuracy requirements.
As the founder of MachineMFG, I have dedicated over a decade of my career to the metalworking industry. My extensive experience has allowed me to become an expert in the fields of sheet metal fabrication, machining, mechanical engineering, and machine tools for metals. I am constantly thinking, reading, and writing about these subjects, constantly striving to stay at the forefront of my field. Let my knowledge and expertise be an asset to your business.
Have you ever wondered what makes sheet metal so versatile in engineering? This article explores the fascinating world of sheet metal, diving into its material properties, manufacturing processes, and design…
Have you ever wondered about the mechanical properties of different metals? In this article, we dive deep into the shear strength, tensile strength, and other key characteristics of various ferrous…
Imagine your car engine failing in the middle of a scorching desert because the materials couldn't withstand the heat. This scenario underscores the vital importance of understanding how high temperatures…
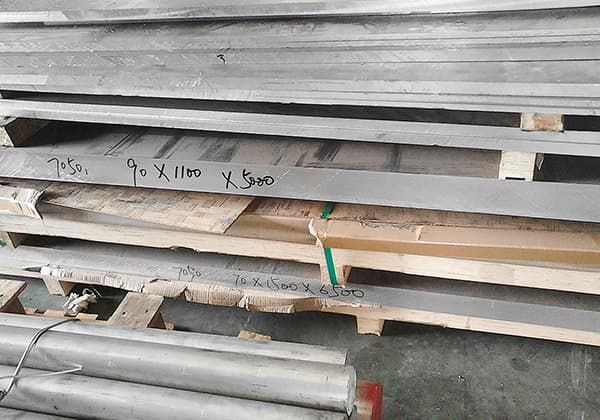
What makes 7050 aluminum alloy a standout material in high-strength applications? This blog post explores its unique composition, including zinc, magnesium, copper, and zirconium, which enhance its strength and resistance…
In this blog post, we'll explore the world of mechanical seals and introduce you to the top manufacturers who ensure your equipment runs smoothly. Discover the innovations and expertise that…
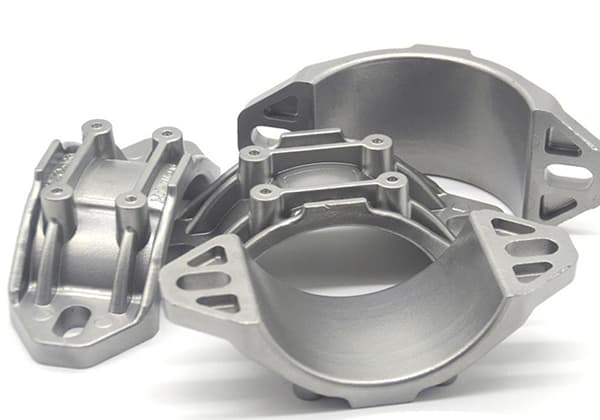
Have you ever wondered what makes your car's engine parts so durable and efficient? This article unveils the secrets behind casting aluminum alloys, the unsung champions of automotive engineering. Learn…
Imagine your car engine seizing up on a long drive or a factory machine grinding to a halt during peak production. At the heart of these issues lies a critical…
Have you ever wondered how mechanical structures transform ideas into tangible designs? Mechanical structure design turns abstract principles into detailed schematics, ensuring every part is optimized for functionality, strength, and…
Imagine a world where machines can see, feel, and respond to their surroundings with unparalleled precision. This is the promise of novel sensing technologies in mechanical engineering. By integrating advanced…