Have you ever considered the impact of surface roughness on your products? In this blog post, we’ll explore the critical role surface roughness plays in manufacturing and how it affects product quality, performance, and durability. Our expert mechanical engineers will share valuable insights and practical tips to help you optimize your manufacturing processes and deliver superior products to your customers. Get ready to discover the secrets of achieving the perfect surface finish!
In technical communication, the term “surface finish” is commonly used. However, it should be noted that “surface finish” is based on human perception, while “surface roughness” is based on the actual surface microgeometry.
To align with international standards (ISO), the use of “surface finish” is no longer acceptable in national standards. The preferred and more accurate term is “surface roughness.”
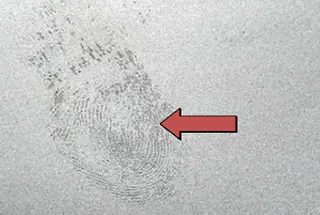
Surface roughness refers to the unevenness of a machined surface, characterized by small peaks and valleys with close spacing. The distance between these peaks and valleys, known as wave distance, is typically less than 1mm, which falls under the category of microgeometry errors.
It is specifically defined by the level of high and low micro peaks and valleys (Z) and the spacing (s) between them.
Generally according to S:
S < 1 mm – surface roughness
1 ≤ s ≤ 10mm- waviness
S > 10 mm- f shape
2. Comparison Table of VDI3400, Ra and Rmax
In national standards, three indicators are commonly used to assess surface roughness (unit is μm).
Average arithmetic deviation of the contours: Ra
The average height of unevenness: Rz
Maximum height: Ry
The Ra index is widely used in actual production. The maximum microscopic height deviation of a contour, Ry, is commonly referred to as Rmax in Japan and other countries, while the VDI index is commonly used in Europe and America. The following table compares VDI3400, Ra, and Rmax.
The VDI3400 surface has a corresponding relationship with the widely used Ra standard. Many people find it necessary to consult reference data to determine the corresponding value. The following table is comprehensive and it is recommended to keep it for reference.
Comparison table of VDI3400 standard and Ra
VDI
Ra
VDI
Ra
3400
μm
3400
μm
0
01
23
1.4
1
0.112
24
1.6
2
0.126
25
1.8
3
0.14
26
2
4
0.16
27
2.2
5
0.18
28
2.5
6
0.2
29
2.8
7
0.22
30
3.2
8
0.25
31
3.5
9
0.28
32
4
10
0.32
33
5
11
0.35
34
5
12
0.4
35
5.6
13
0.45
36
6.3
14
0.5
37
7
15
0.56
38
8
16
0.63
39
9
17
0.7
40
10
18
0.8
41
11.2
19
0.9
42
12.6
20
1
43
14
21
1.12
44
16
22
1.26
45
18
Comparison table of RA and Rmax
Ra (μm)
Rmax (μm)
0.1
0.4
0.2
0.8
0.4
1.5
0.56
2.4
0.8
3.3
1.12
4.7
1.6
6.5
2.2
10.5
3.2
12.5
4.5
17.5
6.3
24
3. Surface Roughness Formation Factors
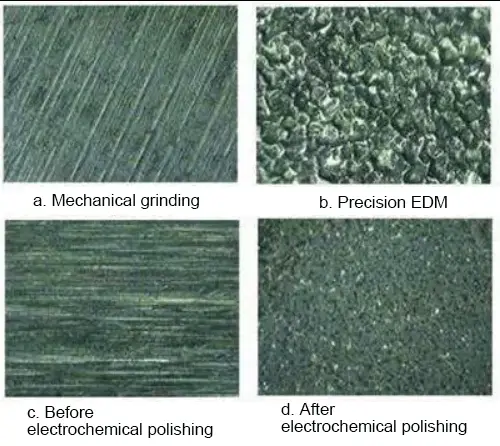
Surface roughness is typically formed by various factors, including the processing method used.
For instance, factors contributing to surface roughness include friction between the tool and the surface of the part during machining, plastic deformation of the surface layer metal during chip separation, high-frequency vibrations in the processing system, and discharge pits in electrical machining.
The depth, density, shape, and texture of the marks left on the processed surface can vary due to differences in processing methods and workpiece materials.
4. Main Effects of Surface Roughness on Parts
The Impact on Wear Resistance:
The rougher the surface, the smaller the effective contact area between mating surfaces, the higher the pressure, and the higher the frictional resistance, resulting in faster wear.
The Impact on Gap Fit Stability:
For gap fit, a rougher surface leads to increased wear and a gradual increase in the gap during operation. In the case of interference fit, the actual effective interference is reduced due to the flattening of microscopic convex peaks during assembly, leading to a decrease in connection strength.
The rough surface of a part has large troughs that are susceptible to stress concentration, similar to sharp-edged notches and cracks, affecting the part’s fatigue strength.
The Impact on Corrosion Resistance:
Rough part surfaces can easily allow corrosive gases or liquids to penetrate the microscopic valleys on the surface and reach the metal inner layer, causing surface corrosion.
The Impact on Sealability:
Rough surfaces do not fit tightly against each other, allowing gases or liquids to leak through the gaps between contact surfaces.
The Impact on Contact Stiffness:
Contact stiffness refers to a part’s bonding surfaces’ ability to resist deformation under external forces. The stiffness of a machine is largely dependent on the contact stiffness between its parts.
The Impact on Measurement Accuracy:
Parts are measured by their surface and the roughness of the measuring tool’s surface will directly affect measurement accuracy, especially in precision measurement.
Additionally, surface roughness has a variable effect on a part’s coating, thermal and contact resistance, reflectance and radiation properties, resistance to liquid and gas flow, and current flow through the surface of a conductor.
5. Evaluation Basis of Surface Roughness
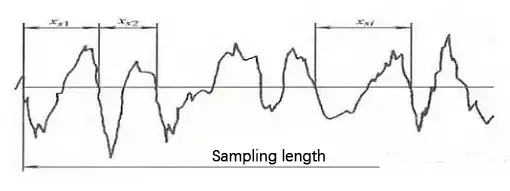
Sampling length
The sampling length is the length of a designated reference line used to evaluate surface roughness.
To accurately reflect the surface roughness characteristics of a part, the sampling length should be selected based on the formation and texture of the actual surface. The sampling length should be measured in accordance with the general profile of the actual surface.
The purpose of specifying and selecting the sample length is to minimize the impact of surface ripple and shape errors on surface roughness measurement results.
The unit length and sampling length for each surface roughness parameter are determined by a specified reference line for evaluation.
According to ISO1997 standards, the common reference lengths are 0.08mm, 0.25mm, 0.8mm, 2.5mm, and 8mm.
Sampling length Ln and evaluation length L of RA, RZ and Ry
Ra(μm)
Rz.Ry(μm)
L(mm)
Ln=5L(mm)
≥ 0.008-0.02
≥ 0.025-0.10
0.08
0.4
>0.02-0.1
>0.10-0.50
0.25
1.25
>01-2.0
>0.50-10.0
0.8
4
>2.0-10.0
>10.0-50.0
2.5
12.5
>10.0-80.0
>50.0-320
8
40
Evaluation length
The evaluation length is a required length used to assess the contour and may include one or multiple sampling lengths.
Since the surface roughness of a part’s surface is not always uniform, it may not be possible to accurately reflect a specific surface roughness feature with just one sampling length. Hence, multiple sampling lengths on the surface are necessary to evaluate the surface roughness.
Typically, the evaluation length consists of five sampling lengths.
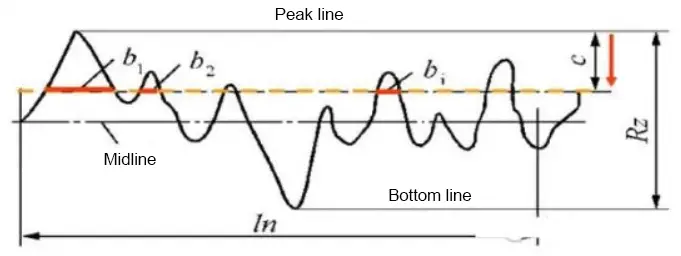
Baseline
The baseline is the centerline of the profile used to evaluate surface roughness parameters. There are two types of baselines:
Least-Squares Centerline of the Contour: This baseline is the line within the sampling length for which the sum of the squares of the contour offset of each point on the contour line is the smallest, and has a geometric contour shape.
Arithmetic Mean Centerline of the Contour: This baseline is the line within the sampling length for which the area of the upper and lower contours on the centerline is equal.
While the least-squares centerline is an ideal baseline in theory, it is challenging to obtain in practical applications. As a result, the arithmetic mean centerline of the contour is commonly used instead and can be measured using a straight line with an approximate position.
6. Evaluation Parameters of Surface Roughness
1. Altitude characteristics
Contour Arithmetic Mean Deviation (Ra):
Ra is the arithmetic mean of the absolute value of the contour deviation within the specified sampling length (lr).
In actual measurements, a higher number of measurement points results in a more accurate Ra value.
Contour Maximum Height (Rz):
Rz is the distance between the top and bottom lines of the contour.
In common range of magnitude parameters, Ra is preferred.
Prior to 2006, the national standard included an evaluation parameter known as “the height of ten points of micro-unevenness,” which was expressed as Rz and the maximum height of the profile was expressed as Ry.
However, after 2006, the national standard abolished the “ten-point height of microcosmic unflatness” and instead expressed the maximum height of the profile as Rz.
2. Pitch characteristics
Rsm:
Rsm is the average width of the contour unit, representing the average of the microscopic unevenness spacing over the sampled length.
The microscopic unevenness distance refers to the length between a profile peak and the adjacent profile valley on the midline.
Even with the same Ra value, the Rsm value may not be the same, resulting in a different reflected texture.
Surfaces that prioritize texture usually consider both Ra and Rmr metrics.
The Rmr shape feature parameter is expressed as the contour support length ratio, which is the ratio of the contour support length to the sampling length.
The profile support length is calculated as the sum of the length of each section of the profile obtained by drawing a straight line parallel to the centerline and at a distance of “c” from the top line of the profile within the sampling length.
7. Measurement Methods of Surface Roughness
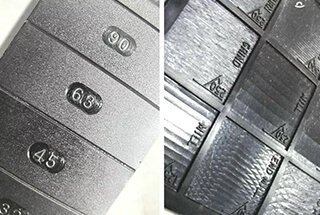
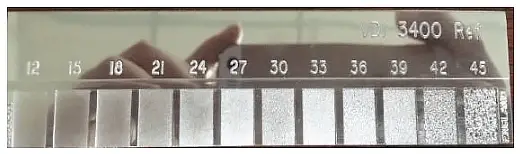
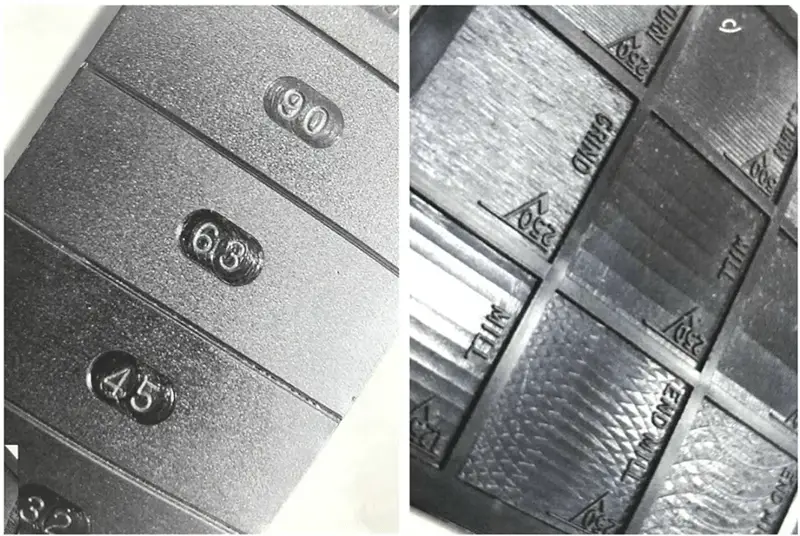
1. Comparative method
It is used for on-site measurement in workshops and is often employed for measuring medium to rough surfaces.
The method involves comparing the measured surface to a roughness model marked with a specific value to determine the roughness value of the measured surface.
Roughness comparators, which are nickel-based electroformed specimens, are ideal for metalworking and serve as an effective aid. The operator simply scrapes their fingernail across each surface in a group to find the closest match to the part being compared.
While some people use these model groups as reference tables, it’s important to note that they are not official material standards.
There are various roughness measuring machines available, each with different functions, evaluation methods, and costs. Before choosing a model, it’s recommended to consult with a professional manufacturer to select the most suitable option for your needs.
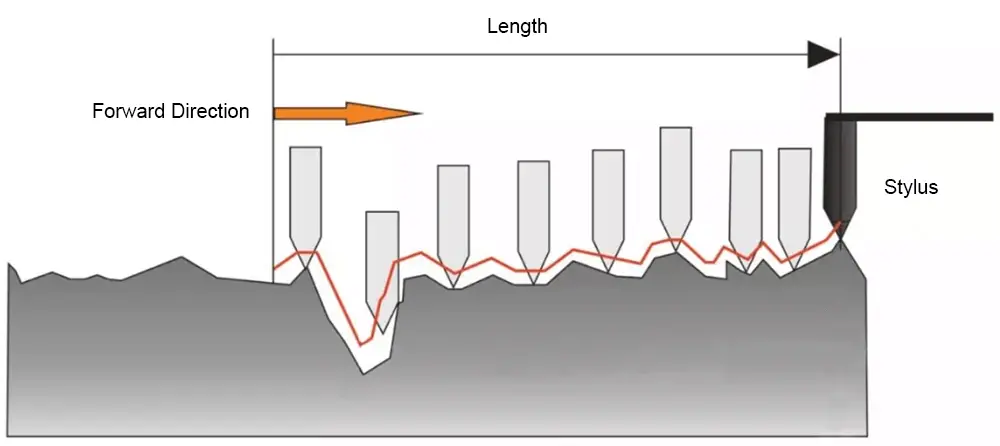
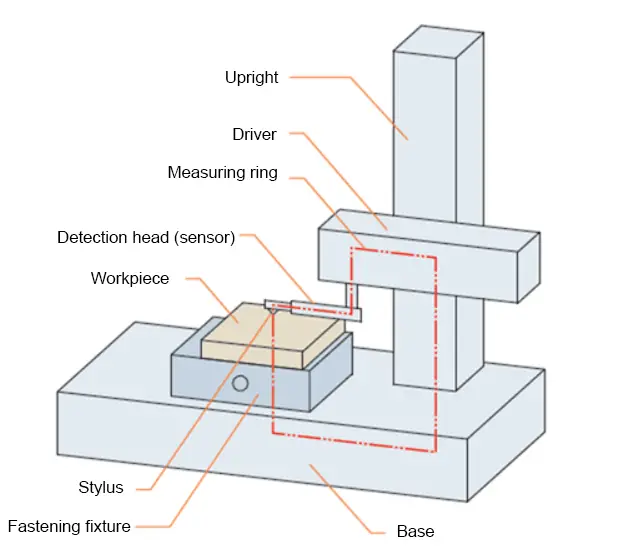
2. Stylus method
Surface roughness measurement involves using a diamond stylus with a tip curvature radius of approximately 2μm to move along the measured surface.
The upward and downward displacement of the diamond stylus is converted into an electrical signal by an electrical length sensor. After amplification, filtering, and calculation, the surface roughness value is displayed on an instrument and the measured profile curve can also be recorded by a recorder.
Instruments that only display surface roughness values are called surface roughness gauges, while those that record surface profile curves are referred to as surface roughness profilers.
Both types of tools have electronic calculation circuits or computers that automatically calculate the contour arithmetic mean deviation (Ra), ten-point height of microscopic unevenness (Rz), maximum contour height (Ry), and other evaluation parameters.
These tools have high measurement efficiency and are suitable for measuring surface roughness with Ra values ranging from 0.025 to 6.3 μm.
8. Surface Roughness: Ra and Rz
Basic Concepts of Ra and Rz
In the old national standard GB/T3505-1983, it is stipulated that the evaluation parameters of surface roughness should be selected from three aspects: the arithmetic mean deviation of the contour (Ra), the ten-point height of micro-unevenness (Rz), and the maximum height of the contour (Ry).
Ra is known as the arithmetic mean deviation of the contour or the mean value of the centerline. It is the arithmetic average of the heights of the points on the contour within the measurement length.
Rz is known as the ten-point height of micro-unevenness. It is the sum of the average values of the five highest contour peaks and the five deepest contour valleys within the sampling length l.
The Breadth of Use Varies Between the Two
Ra is the primary evaluation parameter, while Rz is generally only used to represent shorter surfaces. In actual processing, Ra is more commonly used to express roughness than Rz.
The Calculation Methods are Different
The arithmetic mean deviation Ra refers to the arithmetic average of the absolute values of the vertical coordinate Z within a sampling length, denoted as Ra. Rz is the sum of the average values of the five highest contour peaks and the five deepest contour valleys within the sampling length.
The Accuracy Varies Between the Two
Since Rz has fewer measurement points, it does not reflect the characteristics of the height of the micro-geometric shape as fully as the Ra parameter. It does not have the precision of Ra, but it is easier to measure than Ra.
As the founder of MachineMFG, I have dedicated over a decade of my career to the metalworking industry. My extensive experience has allowed me to become an expert in the fields of sheet metal fabrication, machining, mechanical engineering, and machine tools for metals. I am constantly thinking, reading, and writing about these subjects, constantly striving to stay at the forefront of my field. Let my knowledge and expertise be an asset to your business.
Attention all mechanical engineers and manufacturing professionals! Are you struggling with pesky anodizing defects in your aluminum products? Look no further! In this blog post, we'll dive deep into the…
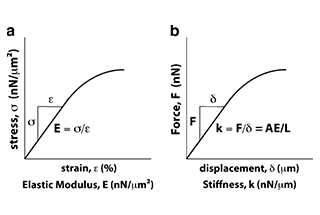
Ever wondered why some materials bend easily while others remain rigid? This blog dives into the fascinating world of elastic modulus and stiffness, unraveling their crucial roles in engineering. By…
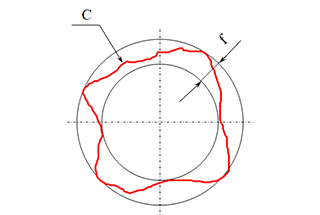
Have you ever wondered what makes a perfect circle? In the world of mechanical engineering, roundness is a crucial concept that affects the performance and longevity of rotating components. This…
In today's fast-paced manufacturing world, efficient deburring is crucial. With numerous methods available, choosing the right one can be daunting. In this blog post, we'll explore various deburring techniques, from…
Have you ever wondered what keeps the world spinning smoothly? The unsung heroes behind the scenes are bearings. These small but mighty components play a crucial role in reducing friction…
Gears are the unsung heroes of the mechanical world, quietly working behind the scenes to keep machines running smoothly. But have you ever wondered what materials these critical components are…
This article explores the top 5 cooling tower manufacturers shaping our world. Learn how these companies innovate to keep industries running smoothly and efficiently. Get ready to uncover the secrets…
Have you ever wondered what keeps our gas systems running smoothly and safely? In this article, we explore top gas regulator manufacturers, uncovering their innovations and contributions to the industry.…
Ever wondered why connecting copper and aluminum wires is problematic? This article explains the risks associated with connecting these two metals due to their differing electrochemical properties, which can lead…