Guillotine Shears: Mechanical Performance Analysis and Optimization
Have you ever wondered how precision and efficiency come together in industrial cutting? This article explores the fascinating world of guillotine shears, detailing their advantages and challenges. Learn how mechanical analysis and optimization can enhance performance, ensuring you stay ahead in the field of mechanical engineering.
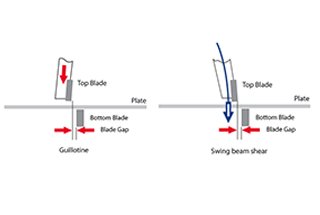
The guillotine shear offers higher efficiency, precision, and reliability compared to the swing beam shear as it eliminates clearance in the structure and allows for adjusting the shear angle.
However, when cutting wide, heavy plates or high strength thin plates, the guillotine shear may face challenges such as machine deformation impacting cutting accuracy.
Most research in this field focuses on the impact of shear parameters on accuracy, the design and automation of the control system, or simulating the shearing process using discrete points.
However, there is limited research on the mechanical property analysis and structure optimization of guillotine shears.
This article aims to address this gap by analyzing the static and dynamic characteristics of the machine tool and simulating the plate shearing process. Through this analysis, continuous shearing data is obtained and an optimization scheme is proposed.
2. Static analysis
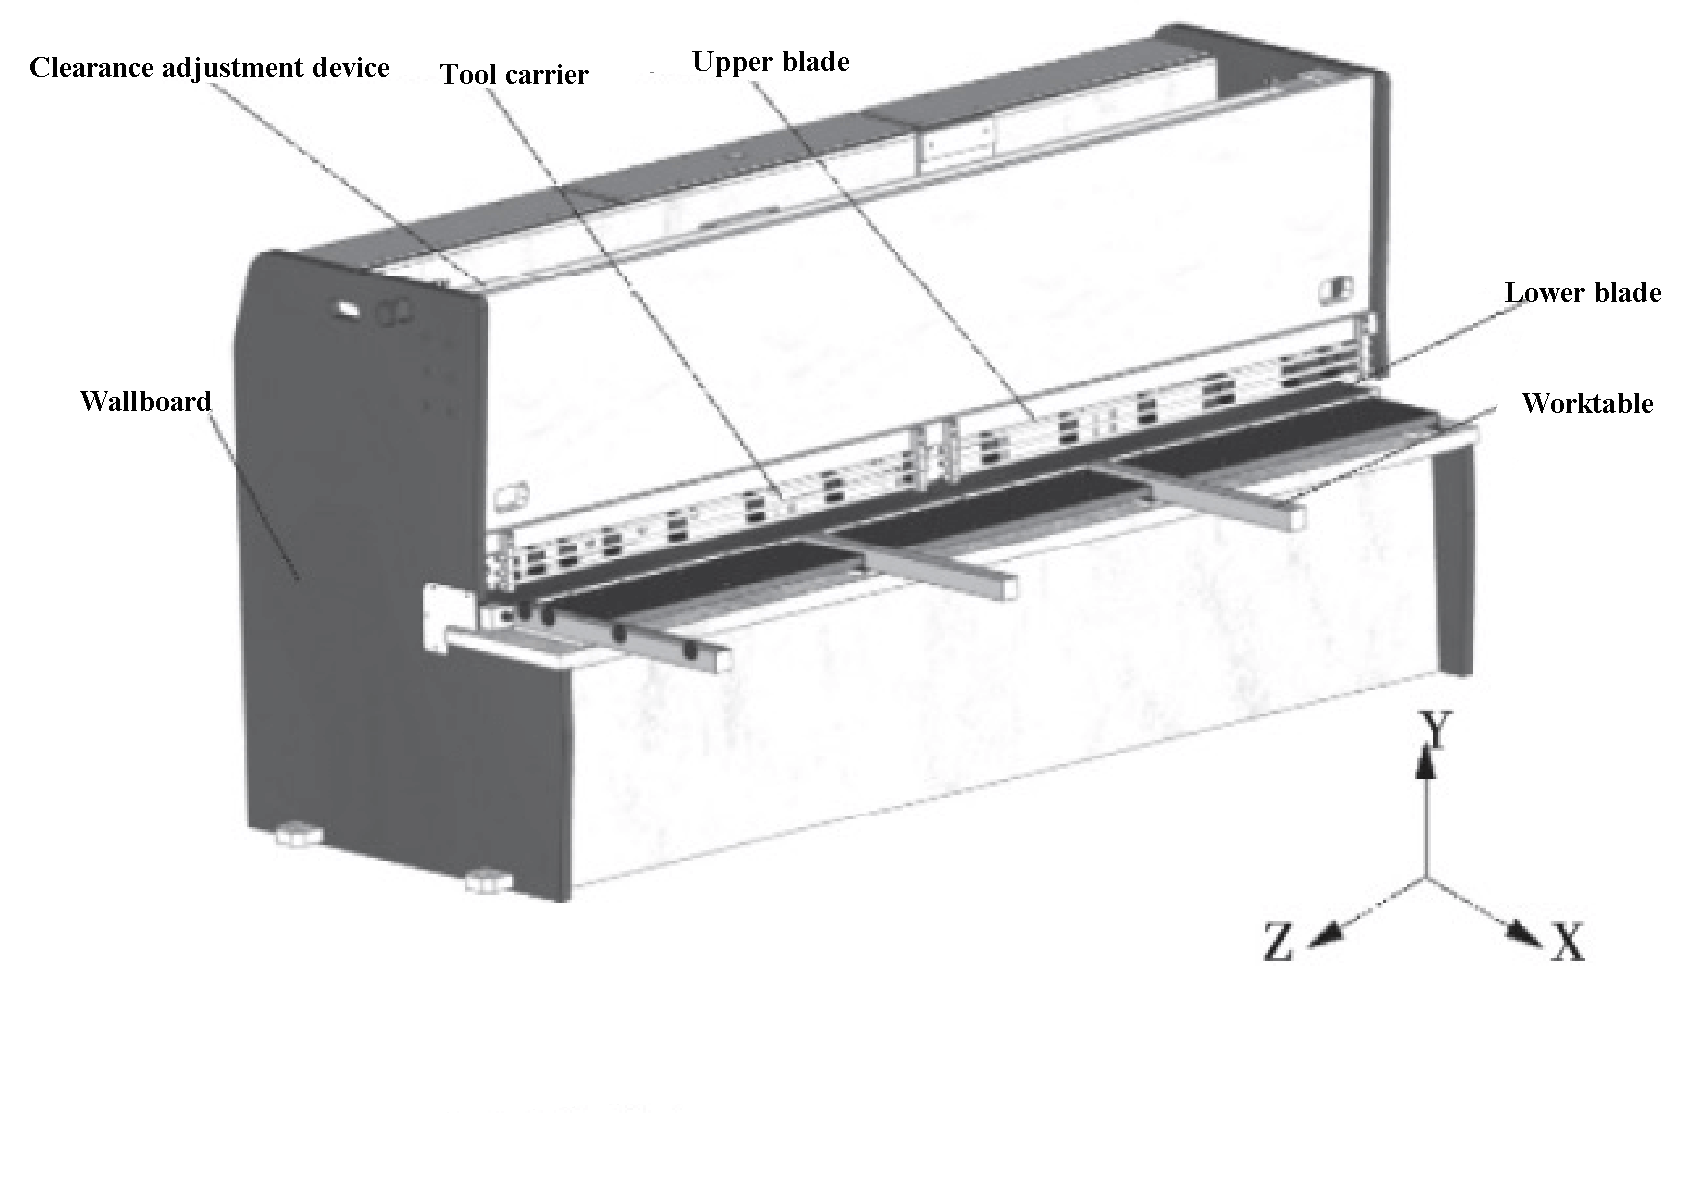
A structural model of a 6 x 3200 NC guillotine shear is shown in Figure 1. During operation, the backstop device, driven by the roller screw, adjusts the cutting length. The pressing cylinder is then compressed by the shearing plate.
Once the cutting parameters, such as blade clearance and shearing angle, are set, the hydraulic cylinders at both ends drive the upper and lower blades to move and complete the plate cutting process.
In the simulation analysis, the transition fillet and threaded hole are disregarded, and a simplified three-dimensional model is imported into a finite element analysis software. The two sides of the upper tool rest are fixed with constraints, and binding contact is established to simulate the welding and thread fixation of the upper tool carrier parts.
Fig. 1 Structural model of 6 × 3200 NC guillotine shear
According to Norsali’s formula:
In the formula:
σb – Strength limit of the plate to be cut;
δs – Ductility of the sheet to be cut;
h – Thickness of the sheet to be cut;
α – Shear angle;
x、y、z – The bending force coefficient, the relative value of the side clearance of the cutting edge and the pressing coefficient.
The vertical shear force (P1) is calculated to be 212.8 kN using formula (1), while the horizontal shear force (P2) is estimated to be 30% of the vertical shear force, or 63.8 kN. Both the vertical and horizontal shear forces are applied to the upper turret and solved using ANSYS Workbench.
The deformation in each direction at the start, middle, and end of shearing is compared and analyzed. As seen in Table 1, the deformation of the upper carriage in the Y direction is the largest, and the deformation in the X and Z directions can be considered negligible in comparison.
The starting and ending positions of the Y-direction deformation are approximately equal and much less than the middle position. During the shearing process, the deformation of the upper tool holder shows a concave trend.
Table 1 Maximum equivalent stress and maximum deformation in X, Y and Z directions of upper tool holder
Shear position
Maximum equivalent stress /MPa
Maximum deformation in X direction /mm
Maximum deformation in Y direction /mm
Maximum deformation in Z direction /mm
Beginning
137.7
0.020
0.141
0.074
Middle
135.3
0.090
0.183
0.650
End
137.2
0.013
0.151
0.085
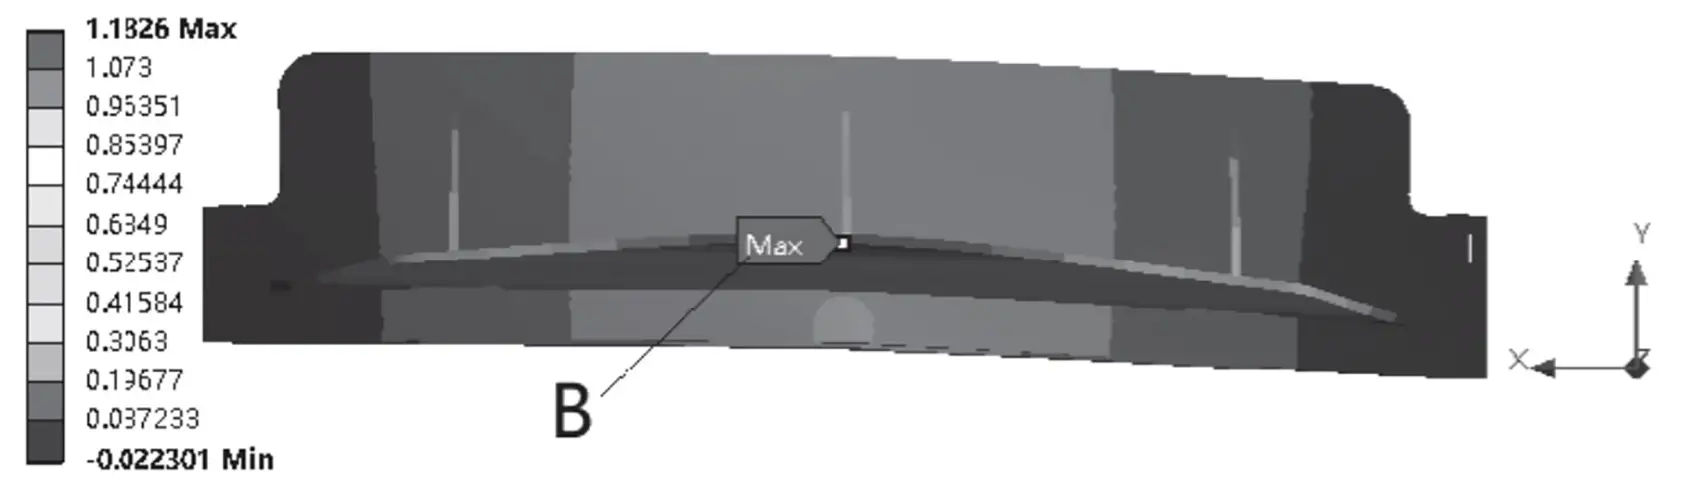
Figures 2 and 3 display the maximum equivalent stress in the middle and the maximum deformation in the Y direction, respectively.
Fig. 2 Maximum equivalent stress of upper tool carrier
Fig. 3 Maximum deformation of upper tool carrier in Y direction
By analyzing Table 1 and Figures 2 and 3, it can be determined that the equivalent stress of the upper tool carrier is the highest at the beginning of the shearing process. This stress is located at the position of the hydraulic cylinder and has a value of 137.7 MPa, which is lower than the yield strength of 235 MPa for the upper tool rest.
At the middle of the shearing process, the maximum deformation of the upper tool holder in the Y direction is observed at the back support plate B, with a size of 1.183 mm. Meanwhile, the blade’s deformation in the Y direction is 0.346 mm, which is less than 1 mm and meets the necessary requirements.
3. Transient dynamic analysis
In the dynamic simulation, a slider is placed at the initial position of the upper blade and is constantly subjected to the shear force with a specified speed. The movement of the slider is used to simulate the plate shearing process.
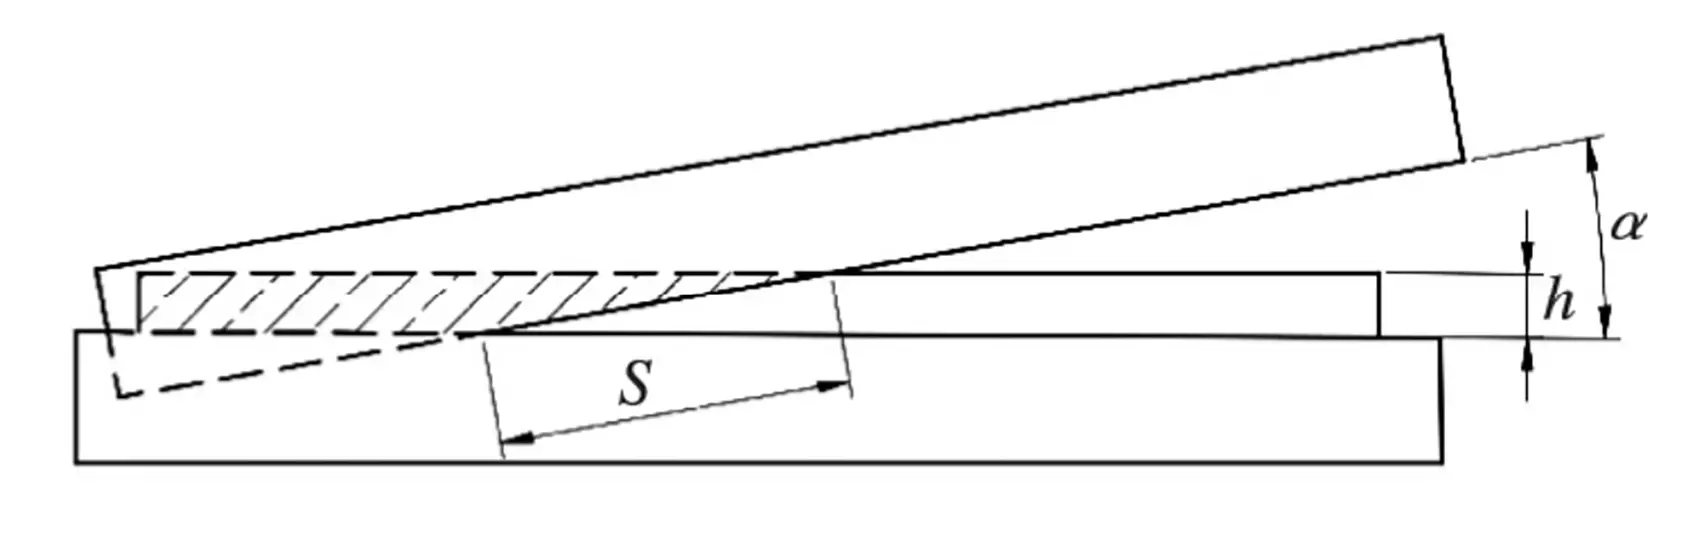
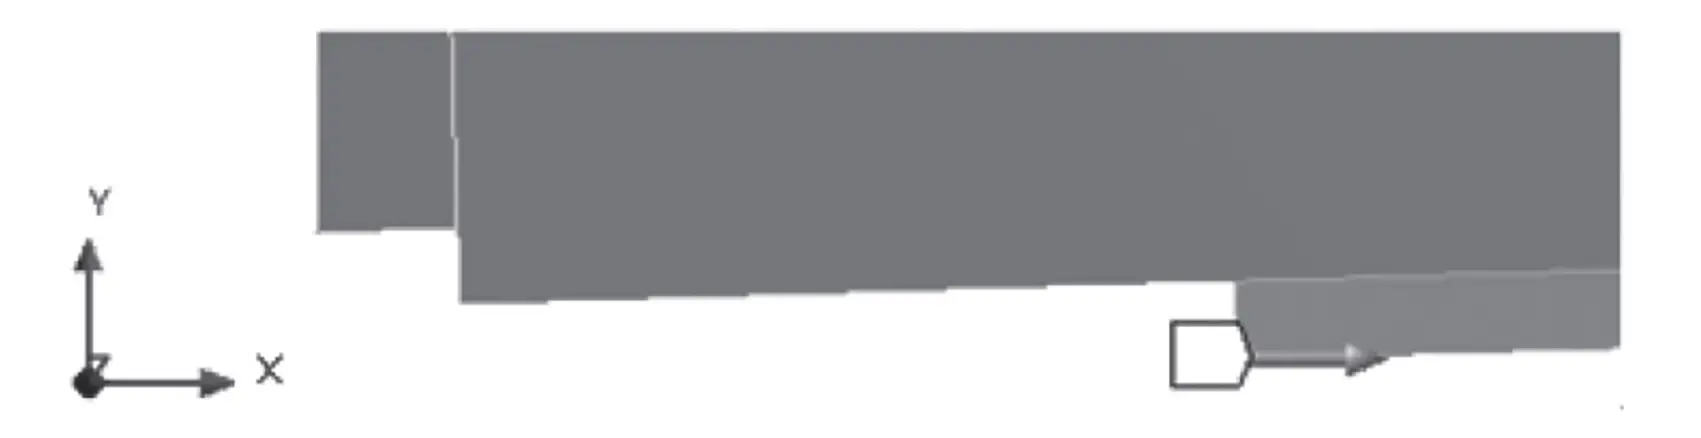
Since the slider only transmits shear force, it has been set to have frictionless contact with the upper blade. During the cutting of the sheet metal, the contact between the upper blade and the sheet metal to be cut is illustrated in Figure 4. The contact length (s) is 8:1.
Fig. 4 Cutting diagram
To simplify the calculation, it is assumed that the shear force is evenly distributed over a rectangular area with the length (s) and the width (t) of the blade. As a result, the slider is modeled as a cuboid with the same length (s) and width (t), as depicted in Figure 5.
Fig. 5 Schematic diagram of slider simulation
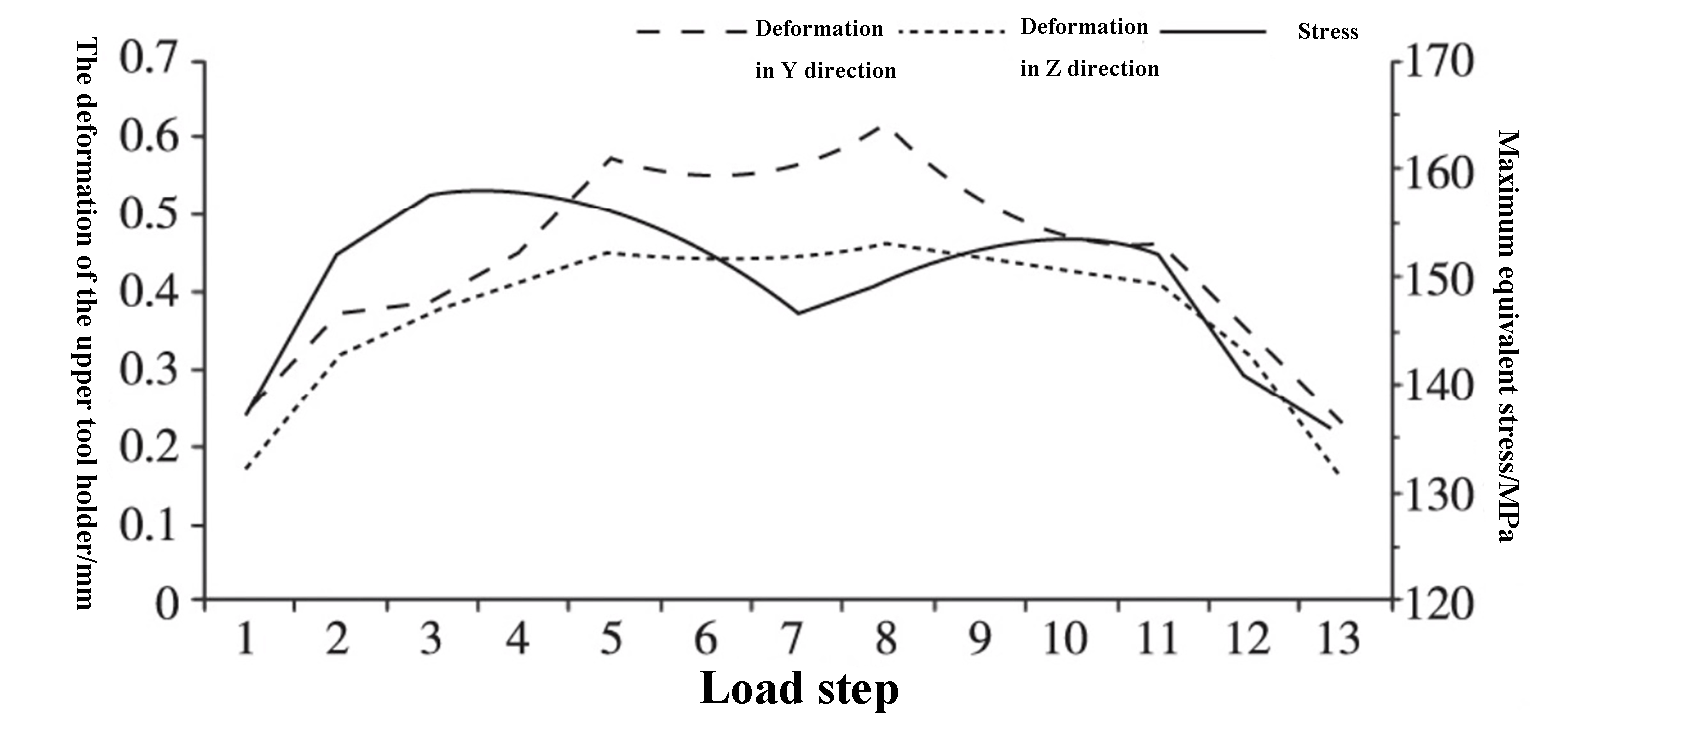
By solving for the maximum equivalent stress and maximum deformation in the Y and Z directions at each position, the results are presented in Table 2. The trend of the deformation and stress of the upper tool holder during the shearing process is shown in Figure 6.
Table 2 maximum equivalent stress and maximum deformation in Y and Z directions of upper tool carrier under each load step
Load step
Maximum equivalent stress /MPa
Maximum deformation in Y direction /mm
Maximum deformation in Z direction /mm
1
138.1
0.265
0.181
2
153.2
0.380
0.330
3
158.4
0.403
0.386
4
159.2
0.469
0.426
5
157.5
0.592
0.463
6
153.8
0.571
0.454
7
148.1
0.580
0.461
8
150.3
0.635
0.478
9
153.7
0.543
0.458
10
154.9
0.477
0.446
11
153.2
0.482
0.425
12
141.8
0.358
0.336
13
136.4
0.250
0.175
As seen in Table 2 and Figure 6, the deformation of the upper tool holder changes with the change in the shear position. The deformation is significant in the middle and relatively small and symmetrical on both sides, aligning with the results from the static simulation.
The maximum deformation of the upper tool holder in the Y and Z directions occurs in load step 8, with values of 0.635 mm and 0.478 mm, respectively, which are less than 1 mm.
The maximum equivalent stress is found in load step 4 and has a value of 159.2 MPa, which is lower than the yield strength of 235 MPa for the upper tool holder.
Fig. 6 Deformation and maximum equivalent stress of upper tool holder in Y and Z directions
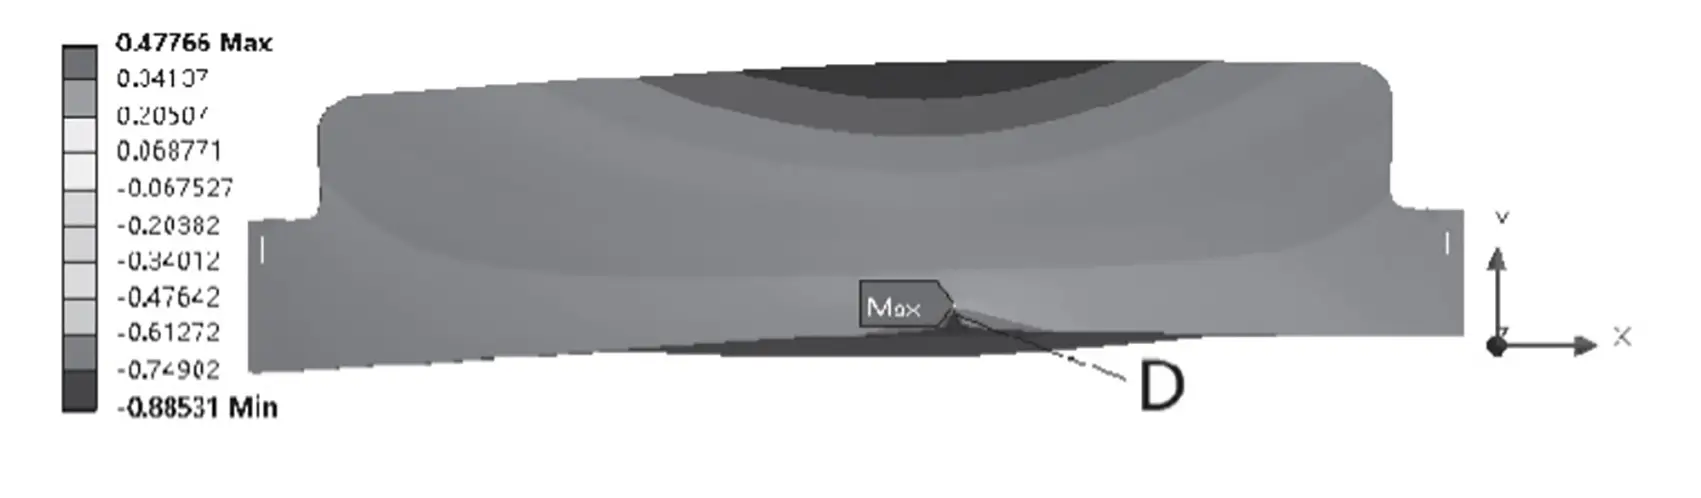
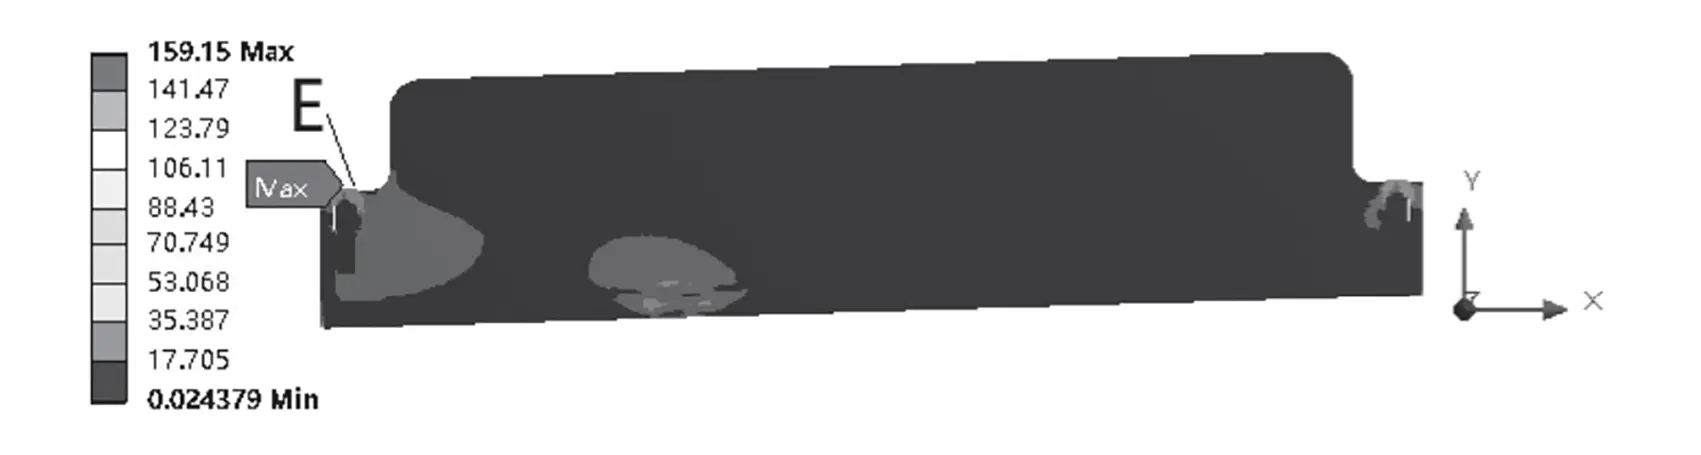
Figures 7, 8, and 9 display the maximum deformation and maximum equivalent stress in the Y and Z directions, respectively.
Fig. 7 Maximum deformation of upper tool carrier in Y direction
Fig. 8 Maximum deformation of upper tool carrier in Z direction
Fig. 9 Maximum equivalent stress of upper tool carrier
From Figures 7, 8, and 9, it can be observed that the maximum deformation of the upper carriage in the Y direction occurs at blade C, while the maximum deformation in the Z direction occurs at blade D. Both deformations are less than 1 mm, fulfilling the design requirements.
The maximum equivalent stress occurs at position E of the upper tool carrier under the influence of the hydraulic cylinder. The stress on the blade is minimal and demonstrates good stiffness.
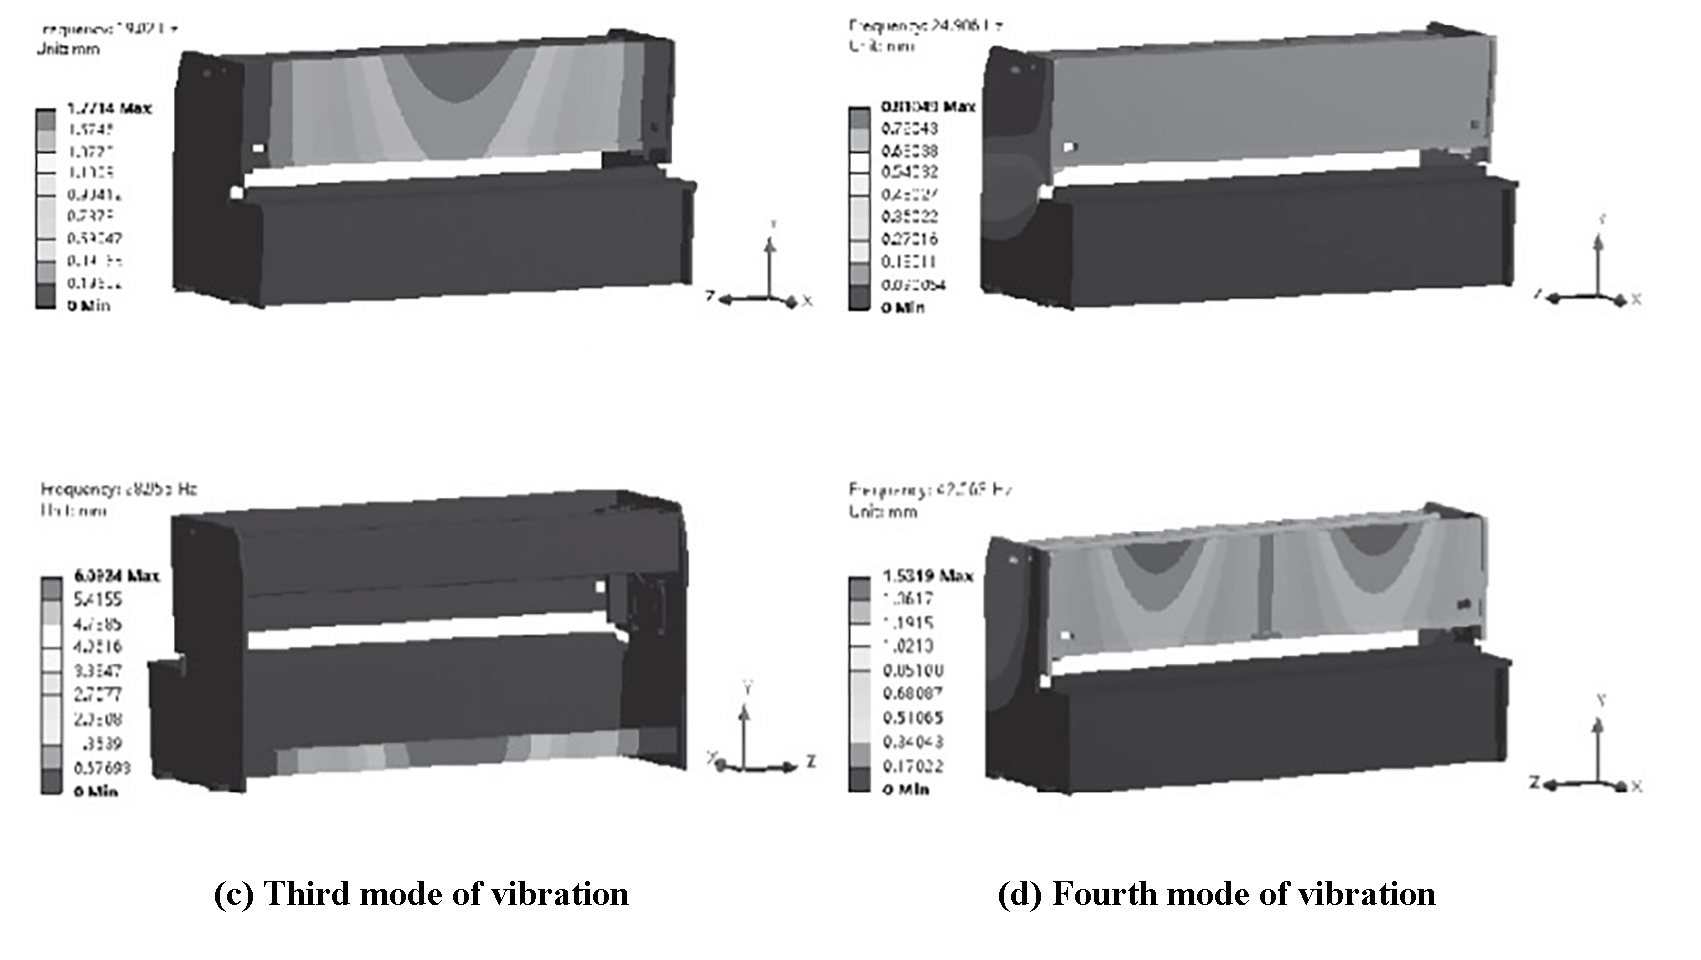
4. Frame modal analysis
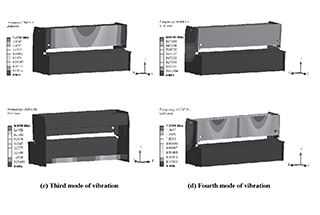
In the modal analysis, the four bases of the frame are fixed and held in place with constraints. The Block Lanczos method is selected as the mode extraction method and the number of expanded modes is set to 4 to solve for the first four natural frequencies of the frame structure.
The four modes of vibration are shown in Figure 10, and Table 3 displays the natural frequencies, amplitudes, and modal shapes of the four structural modes of vibration.
Fig. 10 The four modes of vibration
Table 3 Modal analysis data table of plate shears
Order
Frequency /Hz
Amplitudes /mm
Mode of vibration
1
19.02
1.77
The front panel is bent forward in the X direction
2
24.98
0.81
The upper part of the frame bends and swings in Z direction
3
28.96
6.09
The lower support beam is bent forward along the X direction
4
42.66
1.53
The front panel is bent back and forth in X direction
Based on Figure 10 and Table 3, it can be seen that the vibration deformation of the frame primarily affects the front panel and the lower support beam, causing significant vibration and noise. When the frequency is 19.02 Hz, the amplitude of the front panel is higher, which could negatively impact the shearing process and decrease its accuracy.
However, the shearing frequency of the NC guillotine shear is 9 times per minute, which is significantly lower than the first order natural frequency and meets the requirements for normal operation.
It is important to minimize the influence of external vibration sources during the working process to prevent excessive vibration deformation.
5. Optimization design
The analysis of the static and dynamic characteristics of the shearing process reveals that the deformation of the upper turret presents a concave trend during shearing, which can impact the burr and dimensional accuracy of the blanking and reduce the overall shearing quality.
To improve the cutting quality, the blade clearance in the cutting parameters can be adjusted to increase the positioning stiffness of the upper tool carrier. In this article, a dynamic bevel guide type blade clearance adjustment device has been designed, as shown in Figure 11.
Fig. 11 Structure diagram of inclined guide rail guillotine shear
As the founder of MachineMFG, I have dedicated over a decade of my career to the metalworking industry. My extensive experience has allowed me to become an expert in the fields of sheet metal fabrication, machining, mechanical engineering, and machine tools for metals. I am constantly thinking, reading, and writing about these subjects, constantly striving to stay at the forefront of my field. Let my knowledge and expertise be an asset to your business.
Ever faced the challenge of changing blades on a hydraulic guillotine shear? This detailed guide walks you through the process, ensuring safety and precision at each step. From initial disassembly…
What sets hydraulic guillotine shears apart from swing beam shears, and why do these distinctions matter for your metalworking projects? This article explores the key differences, including blade movement, shear…
Sheet metal shears, as the name implies, is a machine used for cutting sheet metal. The material selection is based on the general Q235 plate. If cutting Q345 plate, then…