There are two types of material coefficients related to temperature: one is related to the mechanical properties of the material, and the other is associated with heat conduction. The former includes factors such as E, G, v, a, while the latter consists of C (specific heat capacity), ρ (density), and k (thermal conductivity).
These coefficients are not constant but vary with temperature. However, when the temperature is not high, their average values are often treated as constants. In situations of high temperature or significant variation, it is essential to consider their changes with temperature.

The elastic modulus E and shear modulus G of metals decrease with increasing temperature, while the Poisson’s ratio v changes little with temperature. The measurements of E and G with temperature can be done statically or dynamically.
The static method involves testing in a high-temperature furnace using load, whereas the dynamic method utilizes vibrational or ultrasonic pulse techniques.
The vibrational method allows the test sample to undergo elastic vibration in the high-temperature furnace, with the elastic constants determined by measuring the frequency.
The ultrasonic method involves applying ultrasonic waves to the test sample, and E, G, and v are determined by measuring the propagation speed of the waves.
The heat coefficient of metal materials generally exhibits a linear relationship with temperature. The linear expansion coefficient α tends to increase linearly as the temperature rises, while the thermal conductivity k decreases as the temperature increases, and specific heat capacity increases with temperature.
The slope of the line or the curvature of the curve representing the relationship between the heat coefficient and temperature, as measured by experimental tests, reveals how the heat coefficient of the specific material changes with temperature.
For instance, the variation in the heat coefficient of carbon steel with temperature is depicted in the following chart, as derived from various data sources.


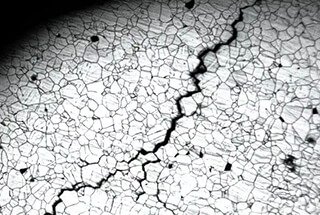
As the temperature of ductile materials rises, they will not immediately fail even if the stress they are subjected to exceeds the yield point. However, even if the stress level is low, should considerable temperature changes be repeated, they will ultimately fail due to fatigue, resulting in cracks. This phenomenon is known as thermal fatigue.
Consider a test rod fixed at both ends, subjected to repeated heat cycles between the highest and lowest temperatures, as depicted in the following diagram.

Suppose at the onset of the experiment, the rod is secured at the highest temperature, then cooled to generate tensile stress, OAF represents a stress change line. If reheated, the stress-strain curve initially moves parallel to OA downwards, yielding at a stress lower than the cooling cycle tensile force, eventually reaching point E.
If maintained at the highest temperature for a while, stress relaxation occurs resulting in a decrease in compressive stress, reaching point E’. If cooling resumes, it rises along E’F’, reaching point F’ at the lowest temperature.
As no pressure relaxation occurs at the lowest temperature, if reheating commences, the curve falls along F’E”, reaching point E” at the highest temperature. Due to stress relaxation, the stress reduces and moves to point E”‘, if cooling resumes, it follows the curve E”‘F” reaching point F” at the lowest temperature.
If this cooling and heating cycle is repeated, the stress-strain curve traces a hysteresis loop each time, the associated recovery plastic strain is the cause of thermal fatigue. The maximum and minimum temperatures of the thermal cycle, average temperature, hold time at maximum temperature, repetition speed, and the elastic-plastic properties of the material are all factors affecting thermal fatigue.
The intensity of thermal fatigue refers to the relationship between a cycle’s plastic strain εP and the number of repetitions N to reach failure. According to the empirical formula of Manson-Coffin:

Herein, εf denotes the elongation at the point of material failure during a static tensile test at the average temperature of a thermal cycle.
The aforementioned description only pertains to unidirectional thermal stress fatigue of a material. However, the thermal fatigue in actual structures is multidirectional and constitutes a specialized field of study.

As the founder of MachineMFG, I have dedicated over a decade of my career to the metalworking industry. My extensive experience has allowed me to become an expert in the fields of sheet metal fabrication, machining, mechanical engineering, and machine tools for metals. I am constantly thinking, reading, and writing about these subjects, constantly striving to stay at the forefront of my field. Let my knowledge and expertise be an asset to your business.


