Imagine a world where materials bend to our will, where strength and resilience are at our fingertips. In this captivating blog post, we dive into the fascinating realm of metal hardness comparison. Uncover the secrets behind Vickers, Brinell, and Rockwell scales, as our expert mechanical engineer guides you through the intricacies of this essential topic. Get ready to expand your knowledge and master the art of material selection.
Hardness testing is the simplest and most straightforward method among mechanical property tests. In order to replace certain mechanical property tests with hardness tests, a relatively accurate conversion relationship between hardness and strength is needed in production.
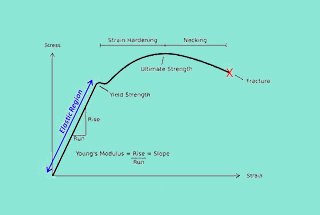
Experience has shown that there is an approximate corresponding relationship between the various hardness values of metal materials, and between hardness values and strength values. This is because the hardness value is determined by the initial plastic deformation resistance and the continued plastic deformation resistance. The higher the strength of the material, the higher the plastic deformation resistance, and thus the higher the hardness value.
1. Hardness Comparison: Vickers Hardness vs Brinell Hardness vs Rockwell Hardness
Tensile strength N/mm2
Vickers hardness
Brinell hardness
Rockwell hardness
Rm
HV
HB
HRC
250
80
76
270
85
80.7
285
90
85.2
305
95
90.2
320
100
95
335
105
99.8
350
110
105
370
115
109
380
120
114
400
125
119
415
130
124
430
135
128
450
140
133
465
145
138
480
150
143
490
155
147
510
160
152
530
165
156
545
170
162
560
175
166
575
180
171
595
185
176
610
190
181
625
195
185
640
200
190
660
205
195
675
210
199
690
215
204
705
220
209
720
225
214
740
230
219
755
235
223
770
240
228
20.3
785
245
233
21.3
800
250
238
22.2
820
255
242
23.1
835
260
247
24
850
265
252
24.8
865
270
257
25.6
880
275
261
26.4
900
280
266
27.1
915
285
271
27.8
930
290
276
28.5
950
295
280
29.2
965
300
285
29.8
995
310
295
31
1030
320
304
32.2
1060
330
314
33.3
1095
340
323
34.4
1125
350
333
35.5
1115
360
342
36.6
1190
370
352
37.7
1220
380
361
38.8
1255
390
371
39.8
1290
400
380
40.8
1320
410
390
41.8
1350
420
399
42.7
1385
430
409
43.6
1420
440
418
44.5
1455
450
428
45.3
1485
460
437
46.1
1520
470
447
46.9
1557
480
456
47
1595
490
466
48.4
1630
500
475
49.1
1665
510
485
49.8
1700
520
494
50.5
1740
530
504
51.1
1775
540
513
51.7
1810
550
523
52.3
1845
560
532
53
1880
570
542
53.6
1920
580
551
54.1
1955
590
561
54.7
1995
600
570
55.2
2030
610
580
55.7
2070
620
589
56.3
2105
630
599
56.8
2145
640
608
57.3
2180
650
618
57.8
660
58.3
670
58.8
680
59.2
690
59.7
700
60.1
720
61
740
61.8
760
62.5
780
63.3
800
64
820
64.7
840
65.3
860
65.9
880
66.4
900
67
920
67.5
940
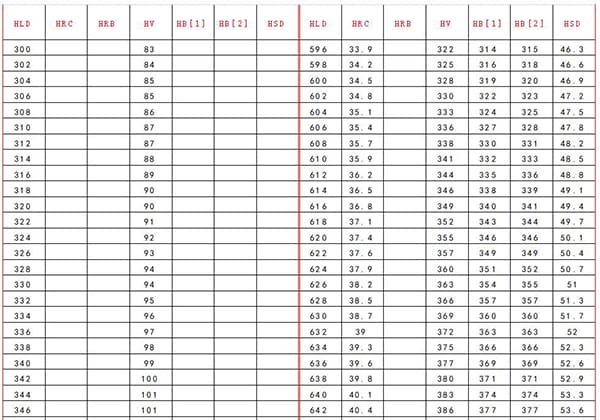
2. Hardness comparison chart of common ferrous metals (Approximate conversion of intensity)
(1) Hardness Conversion Chart for Common Metals (such as Carbon Steel, Alloy Steel, etc.)
Rockwell hardness
Surface Rockwell hardness
Vickers
Brinell
Shore
HRA
HRB
HRC
HRD
15N
30N
45N
HV
HB
HS
60kgf
100kgf
150kgf
100kgf
15kgf
30kgf
45kgf
50kgf
3000kgf
JIS
85.6
68
76.9
93.2
84.4
75.4
940
97.6
85.3
67.5
76.5
93
84
74.3
920
96.4
85
67
76.1
92.9
83.6
74.2
900
95.2
84.7
66.5
75.7
92.7
83.1
73.6
880
94
84.4
65.9
75.3
92.5
82.7
73.1
860
92.8
84.1
65.3
74.8
92.3
82.2
72.2
840
91.5
83.8
64.7
74.3
92.1
81.7
71.8
820
90.2
83.4
64
73.8
91.8
81.1
71
800
88.9
83
63.3
73.3
91.5
80.4
70.2
780
87.5
82.6
62.5
72.6
91.2
79.7
69.4
760
86.2
82.2
61.8
72.1
91
79.1
68.6
740
84.8
81.8
61
71.5
90.7
78.4
67.7
720
83.3
81.3
60.1
70.8
90.3
77.6
66.7
700
81.8
81.1
59.7
70.5
90.1
77.2
66.2
690
81.1
80.8
59.2
70.1
89.8
76.8
65.7
680
80.3
80.6
58.8
69.8
89.7
76.4
65.3
670
79.6
80.3
58.3
69.4
89.5
75.9
64.7
660
78.8
80
57.8
69
89.2
75.5
64.1
650
78
79.8
57.3
68.7
89
75.1
63.5
640
77.2
79.5
56.8
68.3
88.8
74.6
63
630
76.4
79.2
56.3
67.9
88.5
74.2
62.4
620
75.6
78.9
55.7
67.5
88.2
73.6
61.7
610
74.7
78.6
55.2
67
88
73.2
61.2
600
73.9
78.4
54.7
66.7
87.8
72.7
60.5
590
73.1
78
54.1
66.2
87.5
72.1
59.9
580
72.2
77.8
53.6
65.8
87.2
71.7
59.3
570
71.3
77.4
53
65.4
86.9
71.2
58.6
560
70.4
77
52.3
64.8
86.6
70.5
57.8
550
505
69.6
76.7
51.7
64.4
86.3
70
57
540
496
68.7
76.4
51.1
63.9
86
69.5
56.2
530
488
67.7
76.1
50.5
63.5
85.7
69
55.6
520
480
66.8
75.7
49.8
62.9
85.4
68.3
54.7
510
473
65.9
75.3
49.1
62.2
85
67.7
53.9
500
465
64.9
74.9
48.4
61.6
84.7
67.1
53.1
490
456
64
74.5
47.7
61.3
84.3
66.4
52.2
480
448
63
74.1
46.9
60.7
83.9
65.7
51.3
470
441
62
73.6
46.1
60.1
83.6
64.9
50.4
460
433
61
73.3
45.3
59.4
83.2
64.3
49.4
450
425
60
72.8
44.5
58.8
82.8
63.5
48.4
440
415
59
72.3
43.6
58.2
82.3
62.7
47.4
430
405
58
71.8
42.7
57.5
81.8
61.9
46.4
420
397
56.9
71.4
41.8
56.8
81.4
61.1
45.3
410
388
55.9
70.8
40.8
65
81
60.2
44.1
400
379
54.8
70.3
39.8
55.2
80.3
59.3
42.9
390
369
53.7
69.8
110
38.8
54.4
79.8
58.4
41.7
380
360
52.6
69.2
37.7
53.6
79.2
57.4
40.4
370
350
51.5
68.7
109
36.6
52.8
78.6
56.4
39.1
360
341
50.4
68.1
35.5
51.9
78
55.4
37.8
350
331
49.3
67.6
108
34.4
51.1
77.4
54.4
36.5
340
322
48.1
67
33.3
50.2
76.8
53.6
35.2
330
313
47
66.4
107
32.2
49.4
76.2
52.3
33.9
320
303
45.8
65.8
31.6
48.4
75.8
51.8
32.8
310
294
44.6
65.2
105.5
29.8
47.5
74.9
50.2
31.1
300
284
43.4
64.8
29.2
47.1
74.6
49.7
30.4
295
280
42.8
64.5
104.5
28.5
46.5
74.2
49
29.5
290
275
42.2
64.2
27.8
46
73.8
48.4
28.7
285
270
41.6
63.8
103.5
27.1
45.3
73.4
47.8
27.9
280
265
40.9
63.5
26.4
44.9
73
47.2
27.1
275
261
40.3
63.1
102
25.6
44.3
72.6
46.4
26.2
270
256
39.7
62.7
24.8
43.7
72.1
45.7
25.2
265
252
39
62.4
101
24
43.1
71.6
45
24.3
260
247
38.4
62
23.1
42.2
71.1
44.2
23.2
255
243
37.8
61.6
99.5
22.2
41.7
70.6
43.4
22.2
250
238
37.2
61.2
21.3
41.1
70.1
42.5
21.1
245
233
36.5
60.7
98.1
20.3
40.3
69.6
41.7
19.9
240
228
35.9
96.7
18
230
219
34.1
95
15.7
220
209
33.2
93.4
13.4
210
200
31.8
91.5
11
200
190
30.4
89.5
8.5
190
181
29
87.1
6
180
171
27.7
85
3
170
162
26.5
81.7
0
160
152
25
78.7
150
143
23.7
78
140
133
22.1
71.2
130
124
20.6
66.7
120
114
19.1
62.3
110
105
17.6
56.2
100
95
16.1
(2) Hardness Conversion Chart for Soft Metals (such as Copper and Aluminum)
Rockwell hardness
Surface Rockwell hardness
Vickers hardness
HRB
HRF
15T
30T
45T
HV
100kgf
60kgf
15kgf
30kgf
45kgf
50kgf
93.5
110
90
77.5
66
196
109.5
65.5
194
93
77
65
192
92.5
109
76.5
64.5
190
92
89.5
64
188
91.5
108.5
76
63.5
186
91
75.5
63
184
90.5
108
89
62.5
182
90
107.5
75
62
180
89
74.5
61.5
178
88.5
107
61
176
88
88.5
74
60.5
174
87.5
106.5
73.5
60
172
87
59.5
170
86
106
88
73
59
168
85.5
72.5
58.5
166
85
105.5
72
58
164
84
105
87.5
57.5
162
83.5
71.5
56.7
160
83
104.5
71
56
158
82
104
87
70.5
55.5
156
81.5
103.5
70
54.5
154
80.5
103
54
152
80
86.5
69.5
53.5
150
79
102.5
69
53
148
78
102
68.5
52.5
146
77.5
101.5
86
68
51.5
144
77
101
67.5
51
142
76
100.5
85.5
67
50
140
75
100
66.5
49
138
74.5
99.5
85
66
48
136
73.5
99
65.5
47.5
134
73
98.5
84.5
65
46.5
132
72
98
84
64.5
45.5
130
71
97.5
63.5
45
128
70
97
83.5
63
44
126
69
96.5
62.5
43
124
68
96
83
62
42
122
67
95.5
61
41
120
66
95
82.5
60.5
40
118
65
94.5
82
60
39
116
64
94
81.5
59.5
38
114
63
93
81
58.5
37
112
62
92.6
80.5
58
35.5
110
61
92
57
34.5
108
59.5
91.2
80
56
33
106
58
90.5
79.5
55
32
104
57
89.8
79
54.5
30.5
102
56
89
78.5
53.5
29.5
100
54
88
78
52.5
28
98
53
87.2
77.5
51.5
26.5
96
61.6
86.6
77
50.5
24.5
94
49.5
85.4
76.5
49
23
92
47.5
84.4
75.5
48
21
90
46
83.5
75
47
19
88
44
82.3
74.5
45.5
17
86
42
81.2
73.5
44
14.5
84
40
80
73
43
12.5
82
37.5
78.6
72
41
10
80
35
77.4
71.5
39.5
7.5
78
32.5
76
70.5
38
4.5
76
30
74.8
70
36
1
74
27.5
73.2
69
34
72
24.5
71.6
68
32
70
21.5
70
67
30
68
18.5
68.5
66
28
66
15.5
66.8
65
25.5
64
12.5
65
63.5
23
62
10
63
62.5
20.5
60
61
61
18
58
58.8
60
15
56
56.5
58.5
12
54
53.5
57
52
50.5
55.5
50
49
54.5
49
47
53.5
48
45
47
43
46
40
45
HRC / HB Approximate Conversion Tips
When the hardness is higher than 20HRC, 1HRC≈10HB,
When the hardness is lower than 20HRC, 1HRC≈11.5HB.
Note: When considering cutting processing, a general conversion of 1HRC ≈ 10HB applies (the hardness of the workpiece material may vary slightly).
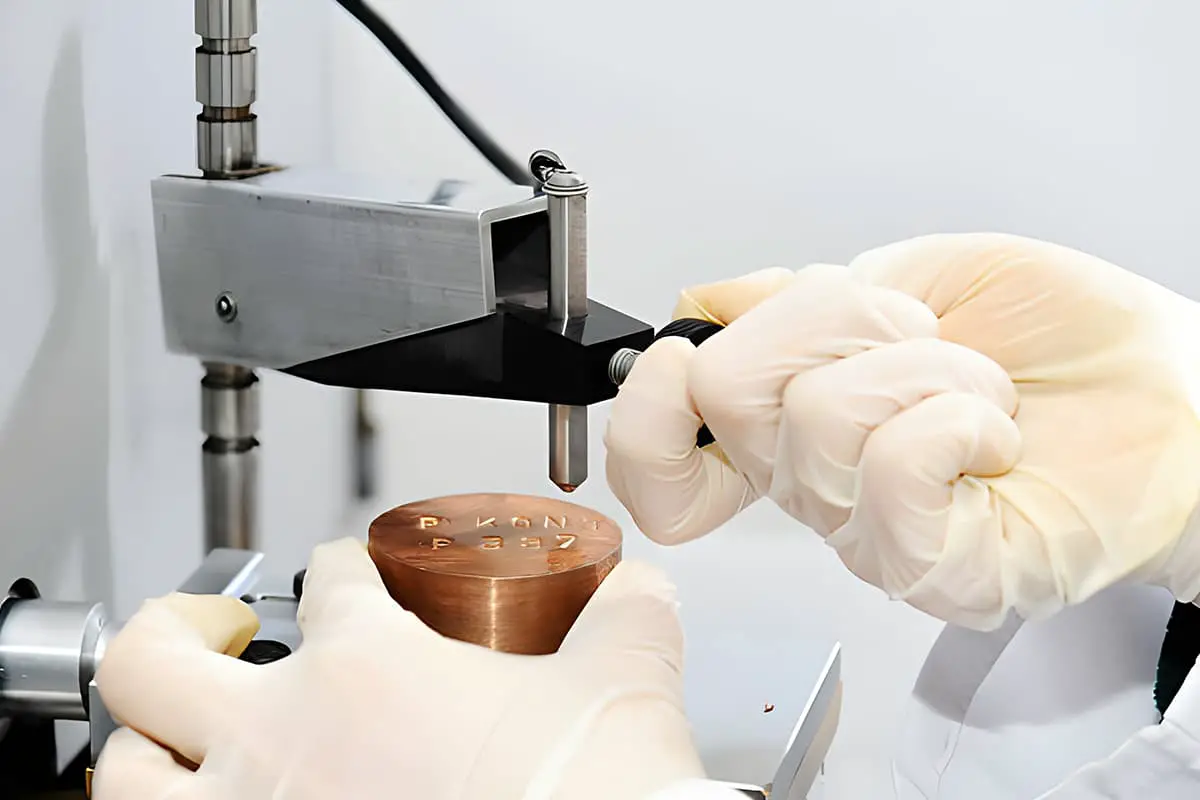
The most commonly used indentation hardness tests for metal materials are Brinell, Rockwell, and Vickers hardness tests.
The hardness value indicates a material’s ability to resist plastic deformation caused by the intrusion of another object.
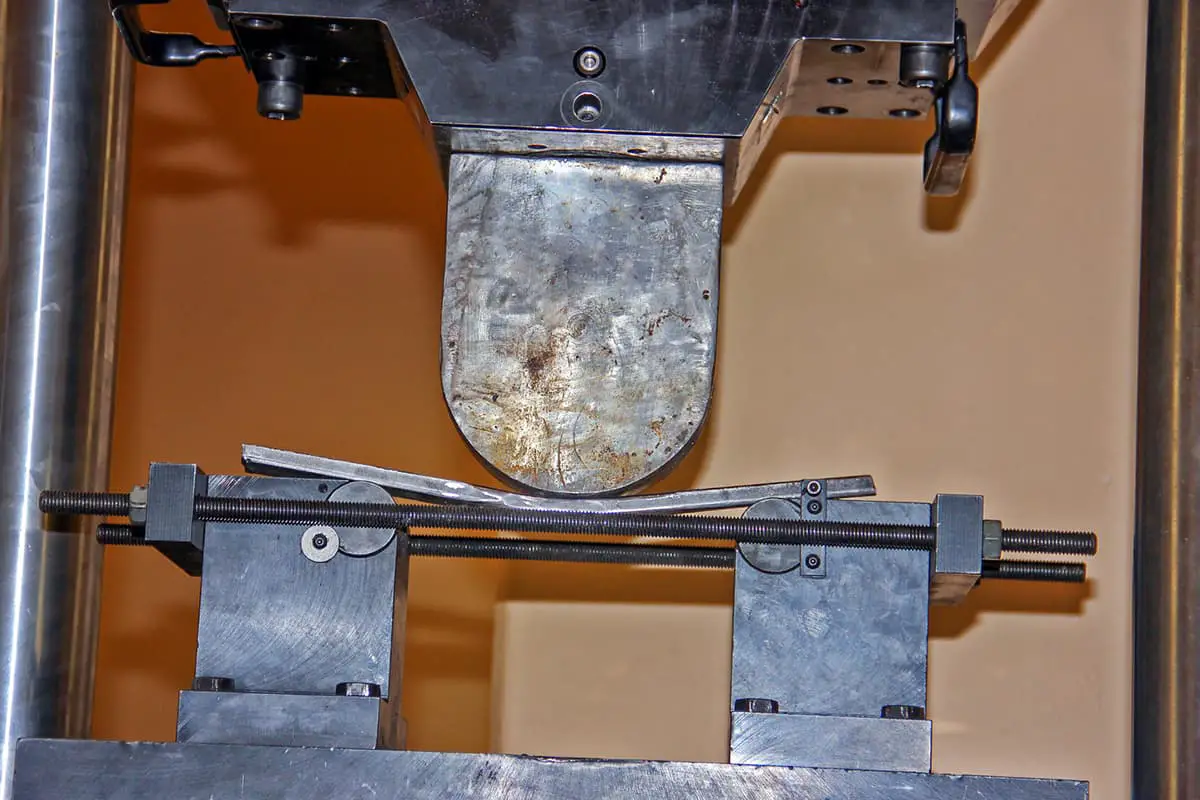
When measuring hardness using the rebound method, the hardness value represents the extent of the metal’s elastic deformation function.
What Is Metal Hardness?
Hardness is a metric that measures a material’s resistance to local deformations, such as plastic deformation, indentations, or scratches.
It is a crucial factor in determining the hardness of a material.
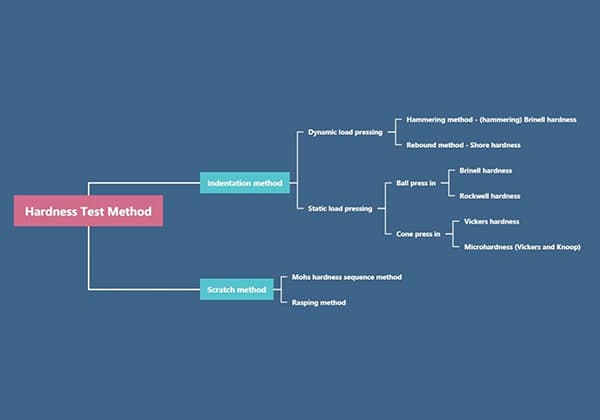
Types of Metal Hardness
According to the different test methods, there are three types of hardness.
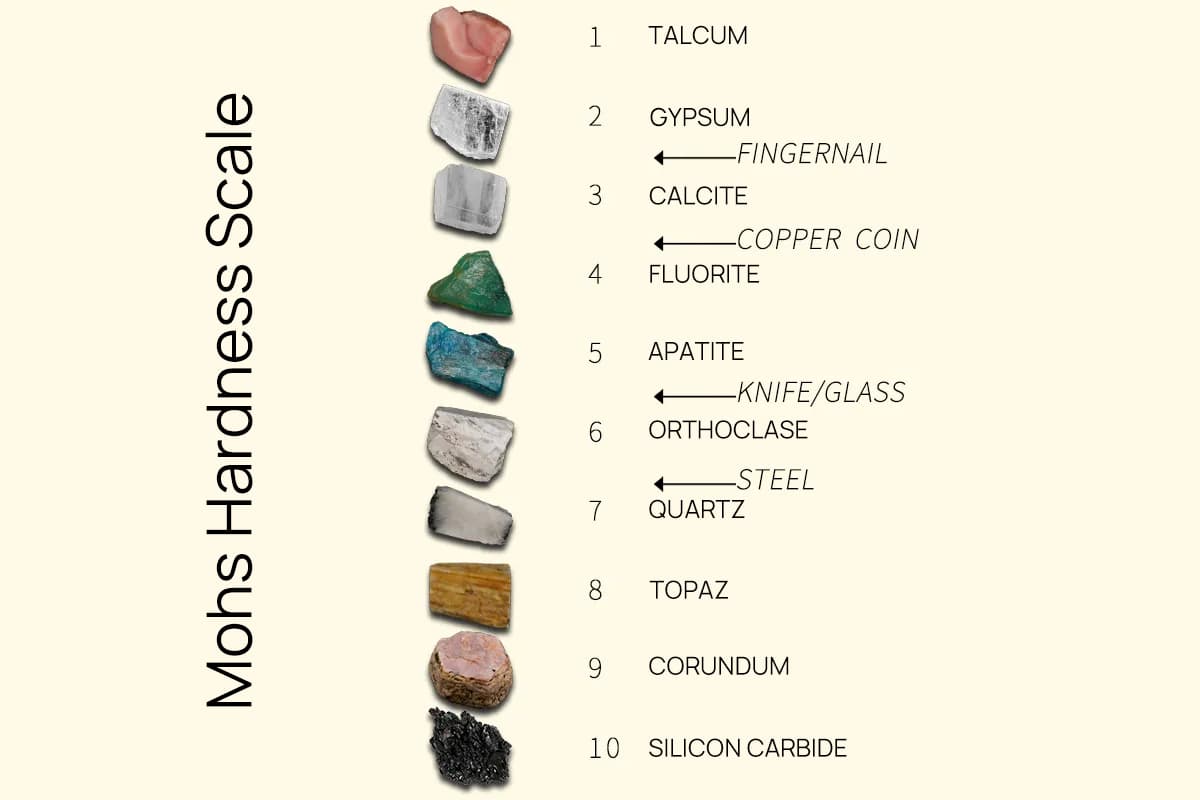
① Scratch hardness
Hardness is primarily utilized to compare the resistance to local deformation of various minerals.
The process involves using a rod with a hard and soft end to test the material by sliding it along the rod.
The material’s softness or hardness is determined based on the length of the scratch it leaves on the rod.
Typically, scratches made by harder materials are longer and those made by softer materials are shorter.
② Indentation hardness
Indentation hardness testing is primarily used to evaluate metal materials. It involves applying a specified indenter to the surface of the material under test with a specific load.
The material’s hardness is determined by comparing the amount of local plastic deformation on the material’s surface.
There are several types of indentation hardness tests, including Brinell hardness, Rockwell hardness, Vickers hardness, and micro-hardness, which differ in terms of the indenter used, the applied load, and the duration of the load.
③ Rebound hardness
Rebound hardness testing is primarily used for metal materials. The method involves using a special small hammer that is dropped from a specific height to impact the material sample being tested.
The material’s hardness is determined by the amount of strain energy stored in and then released from the sample during the impact, which is measured by the rebound height of the hammer.
As the founder of MachineMFG, I have dedicated over a decade of my career to the metalworking industry. My extensive experience has allowed me to become an expert in the fields of sheet metal fabrication, machining, mechanical engineering, and machine tools for metals. I am constantly thinking, reading, and writing about these subjects, constantly striving to stay at the forefront of my field. Let my knowledge and expertise be an asset to your business.
Have you ever wondered why some metal parts fail unexpectedly? Fatigue strength, a critical factor in mechanical engineering, holds the answer. In this insightful article, we delve into the fascinating…
Have you ever wondered what makes sheet metal so versatile in engineering? This article explores the fascinating world of sheet metal, diving into its material properties, manufacturing processes, and design…
Have you ever wondered about the mechanical properties of different metals? In this article, we dive deep into the shear strength, tensile strength, and other key characteristics of various ferrous…
Have you ever wondered how to choose the right aluminum alloy for your project? With a vast array of options, each with unique properties, it can be a daunting task.…
Have you ever wondered what those mysterious numbers on a metal part mean? In this blog post, we'll dive into the fascinating world of hardness testing and explore the different…
Ever wondered why diamonds are so hard? In this article, we’ll explore the fascinating world of material hardness, from talc to diamond. You’ll learn how different tests, like Brinell, Rockwell,…
Have you ever wondered about the hardness of materials around you? From the softness of talc to the unmatched hardness of diamonds, the Mohs scale offers a fascinating journey through…
Why do we measure hardness in materials? Understanding how Rockwell (HRC) and Brinell (HB) hardness scales compare is crucial for selecting the right materials in engineering. This article explores the…
Imagine transforming raw metal powder into complex, high-performance parts without the need for traditional melting processes. This is powder metallurgy—a versatile manufacturing technique that combines powders to create materials with…