Straightness Measurement: How to Calculate Like a Pro
How do you measure the straightness of a guide rail to ensure precise machine operations? This article explores two common methods: the two-end point connection method and the minimum condition method. By comparing these techniques, you’ll learn how each one evaluates straightness errors and why choosing the right method is crucial for accurate measurements. Dive in to understand the pros and cons of each approach, and discover which method suits your needs best for achieving optimal straightness in your engineering projects.
In engineering practice, there are two commonly used methods for evaluating the straightness error of guide rails: the two-end point connection method and the minimum condition method.
The two-end point connection method connects the error curve end-to-end, then draws two lines parallel to the end-to-end line at the highest and lowest points of the curve, and measures the values along the vertical axis between the two parallel lines.
After data processing, the value is the straightness error of the guide rail.
The minimum condition method connects the “high, high” (or “low, low”) points of the error curve and draws a line parallel to it through the low (high) point.
The value measured between the two parallel lines along the vertical axis is the straightness error of the guide rail after data processing.
The minimum condition method is an arbitration evaluation.
The two-end point connection method is not an arbitration evaluation but is commonly used in production due to its simplicity and convenience in evaluation, although it can sometimes produce large errors.
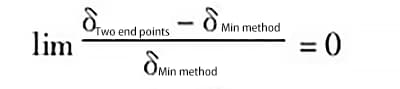
This article discusses the limit value of the error generated between these two evaluation methods.
2. Error curve is on the same side as both ends of the line
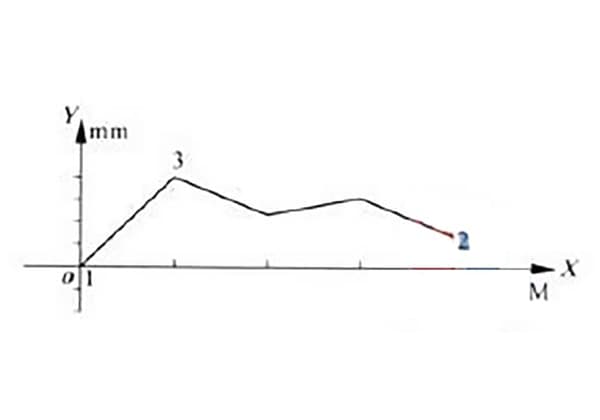
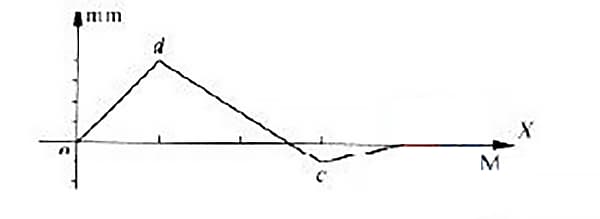
Measuring straightness error of a certain model of hydraulic slide rail guide, the straightness error curve was obtained as shown in Figure 1.
As can be seen from the figure, the error curve is on the same side as both ends of the line.
Below, the straightness error value of the guide rail will be evaluated using the minimum condition method and the two-end connection method.
Figure 1 Error Curve of Guide Rail Straightness
(1) Evaluating straightness error using the minimum condition method
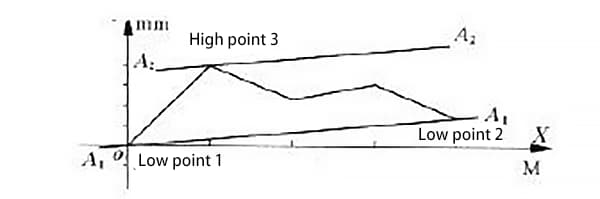
According to the minimum condition method, the lowest points 1 and 2 of the curve in Figure 1 (with low point 1 coinciding with the origin) are connected by line a1a1 as shown in Figure 2.
Parallel line a2a2 is drawn through highest point 3 with respect to line a1a1.
The value measured along the y-axis in the region enclosed by the two parallel lines a1a1 and a2a2, after processing the data, represents the straightness error of the guide rail δ obtained from the minimum condition method.
(2) Evaluating straightness error using the two-end connection method
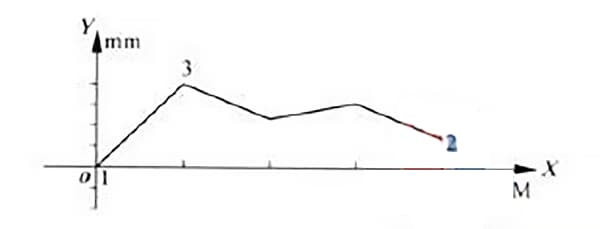
According to the two-end connection method, the ends of the curve in Figure 1 are also the end points 1 and 2 of the curve, as shown in Figure 3.
End points 1 and 2 are connected by line b1b1, and then a parallel line b2b2 is drawn through the highest point.
The value measured along the y-axis in the region enclosed by the two parallel lines b1b1 and b2b2, after processing the data, represents the straightness error of the guide rail δ obtained from the two-end connection method.
Figure 2 Minimum Condition Method
Figure 3 Two end point connection method
(3) Determining the error limit generated by the two evaluation methods
Since both evaluation methods are used to determine the straightness error of the same guide rail, the “low point 1”, “low point 2”, and “high point 3” in Figure 2 correspond respectively to the “end point 1”, “end point 2”, and “high point 3” in Figure 3. This makes line a1a1 coincide with line b1b1, and line a2a2 coincide with line b2b2.
Therefore, the error value generated by the two evaluation methods is zero.
Based on the above analysis, when the error curve is on the same side as both ends of the line, the error limit generated by the two evaluation methods is zero, which means that the evaluation results obtained by the two methods are the same.
3. Error curve is on both sides of the line connecting the ends
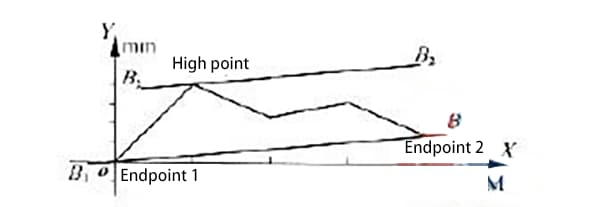
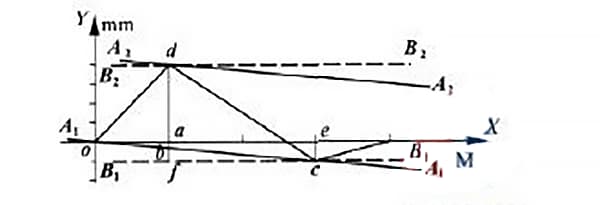
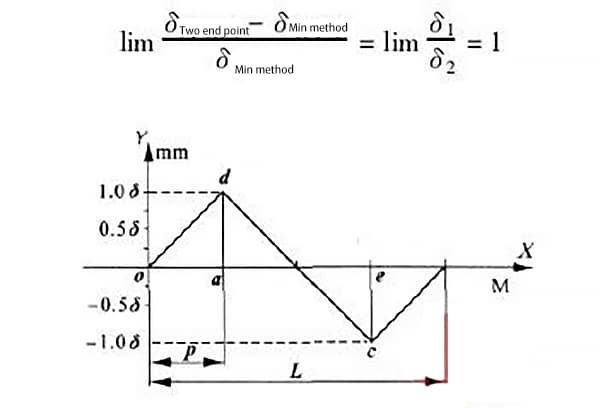
In the measured straightness error curve of a guide rail, some error curves are on both sides of the line connecting the ends, as shown in Figure 4.
The error curve of this guide rail has a line connecting its ends coinciding with the x-axis. The straightness error of the guide rail will be evaluated using the minimum condition method and the two-end connection method.
As can be seen from Figure 4, points o and c are the two low points and the two end points of the curve, while point d is the highest point.
Figure 4 Curve of straightness error of guide rail
According to the minimum condition method, points o and c are connected by line a1a1 as shown in Figure 5. Line a2a2 is drawn parallel to line a1a1 through the highest point d.
The value measured along the y-axis in the region enclosed by the two parallel lines a1a1 and a2a2, after processing the data, represents the straightness error of the guide rail δ obtained from the minimum condition method.
Figure 5 Minimum Condition Method and Endpoint Connection Method
According to the two-point connection method, draw two lines parallel to the x-axis passing through points C and D respectively.
These lines are represented by dotted lines b1b1 and b2b2 in Figure 5. In the region enclosed by these two parallel lines, the value measured along the y-axis, after data processing, represents the straightness error value of the guide rail between the two end points.
To determine the minimum deviation method and the deviation value at the two end points, draw a line parallel to the y-axis passing through point D, intersecting the axis at point A, intersecting line a1a1 at point H, and intersecting line b1b1 at point F.
Similarly, draw a line parallel to the y-axis passing through point C, intersecting the axis at point E.
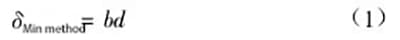
(1) Determination of straightness error using minimum condition method
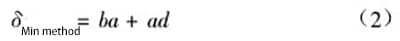
According to the minimum condition method, the straightness error value δ of the guide rail is derived from the value measured along the y-axis after data processing, which represents the minimum deviation method.
As shown in Figure 5:
And since BD = BA + AD,
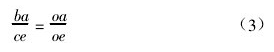
∆OAB and ∆OEC are two similar triangles, therefore,
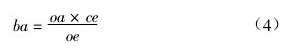
Rearranging equation (3), we get:
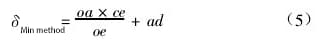
Substituting equation (4) into equation (2) and rearranging, we get:
(2) Determination of straightness error using two-point connection method
According to the two-point connection method, the value measured along the y-axis after data processing represents the straightness error value δ of the guide rail between the two end points.
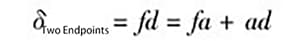
As shown in Figure 5:
And since fa = ce,
(3) Calculation of error values generated by two evaluation methods
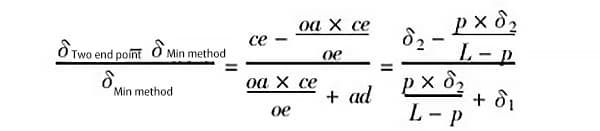
Equation (6) minus equation (5), i.e.,
Rearranging, we get:
(4) Calculation of maximum error generated by two evaluation methods
In Figure 5, let ad = δ1, ce = δ2, oa = p; let the length of the guide rail being measured be l, then oe = l – p, and:
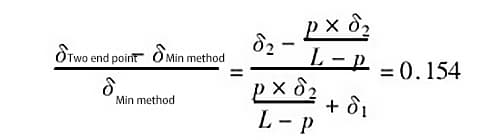
For example, when p = 0.5m (i.e., pitch is 0.5m), δ1 = 1.0δ, δ2 = 0.25δ, and the length of the measured guide rail is l – 2m, then the ratio of error generated by the two evaluation methods is:
The ratio of error generated by the two evaluation methods is 0.154, which means that the error generated by the two-point connection method is 15.4% larger than that generated by the minimum condition method.
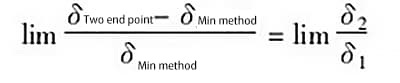
In the above equation, when , i.e., the highest and lowest points of the error curve are infinitely far apart, then, so we get:
For example, when δ1 = 1.0δ and δ2 = 0.25δ and the distance between the highest and lowest points of the error curve is infinitely distant (i.e., L=0.25), then the ratio of error generated by the two evaluation methods is , meaning that the error generated by the two-point connection method is 25% larger than that generated by the minimum condition method.
When δ1 = δ2, i.e., the distance between the highest and lowest points of the error curve is equal, as shown in Figure 6, then the maximum error values generated by the two evaluation methods are:
Figure 6 Equal distance between high and low points of the guide rail
From this, it can be seen that when the highest and lowest points of the guide rail are equal and infinitely far apart, the maximum error generated by the two evaluation methods is the largest and can reach 100%.
Table 1 lists the ratio of errors generated by the two evaluation methods for different lengths of the measured guide rail, when the error curve points are distributed on both sides of the two-point connection line.
The distance between the highest and lowest points of the error curve is equal when the measuring pitch p = 0.5.
Table 1 Error ratio of two evaluation methods
Error ratio
Distance L (M) between the highest and lowest points of the guide rail
1
10
15
20
25
30
40
∞
33.30%
90%
93.30%
95%
96%
96.70%
97.50%
4. Conclusion
If the points on the straightness error curve are on the same side of the two-point connection line, then the errors generated by the two evaluation methods are zero, i.e., the results obtained from the two evaluation methods are the same.
If the points on the straightness error curve are on both sides of the two-point connection line, and the highest and lowest points of the error curve are equal and infinitely far apart, then the maximum error generated by the two evaluation methods is the largest, and the error generated by the two-point connection method can be 100% higher than that generated by the minimum condition method.
Therefore, when evaluating the straightness error of large machine tool guide rails in practical production, it is very important to choose the appropriate evaluation method. When the points on the error curve are on both sides of the two-point connection line, the minimum condition method should be used as the first choice for evaluation.
As the founder of MachineMFG, I have dedicated over a decade of my career to the metalworking industry. My extensive experience has allowed me to become an expert in the fields of sheet metal fabrication, machining, mechanical engineering, and machine tools for metals. I am constantly thinking, reading, and writing about these subjects, constantly striving to stay at the forefront of my field. Let my knowledge and expertise be an asset to your business.
Attention all mechanical engineers and manufacturing professionals! Are you struggling with pesky anodizing defects in your aluminum products? Look no further! In this blog post, we'll dive deep into the…
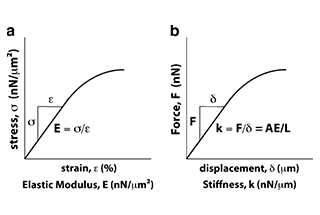
Ever wondered why some materials bend easily while others remain rigid? This blog dives into the fascinating world of elastic modulus and stiffness, unraveling their crucial roles in engineering. By…
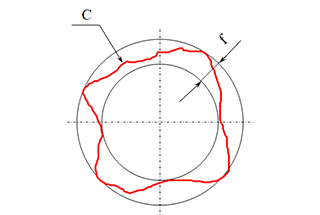
Have you ever wondered what makes a perfect circle? In the world of mechanical engineering, roundness is a crucial concept that affects the performance and longevity of rotating components. This…
In today's fast-paced manufacturing world, efficient deburring is crucial. With numerous methods available, choosing the right one can be daunting. In this blog post, we'll explore various deburring techniques, from…
Have you ever wondered what keeps the world spinning smoothly? The unsung heroes behind the scenes are bearings. These small but mighty components play a crucial role in reducing friction…
Gears are the unsung heroes of the mechanical world, quietly working behind the scenes to keep machines running smoothly. But have you ever wondered what materials these critical components are…
This article explores the top 5 cooling tower manufacturers shaping our world. Learn how these companies innovate to keep industries running smoothly and efficiently. Get ready to uncover the secrets…
Have you ever wondered what keeps our gas systems running smoothly and safely? In this article, we explore top gas regulator manufacturers, uncovering their innovations and contributions to the industry.…
Ever wondered why connecting copper and aluminum wires is problematic? This article explains the risks associated with connecting these two metals due to their differing electrochemical properties, which can lead…